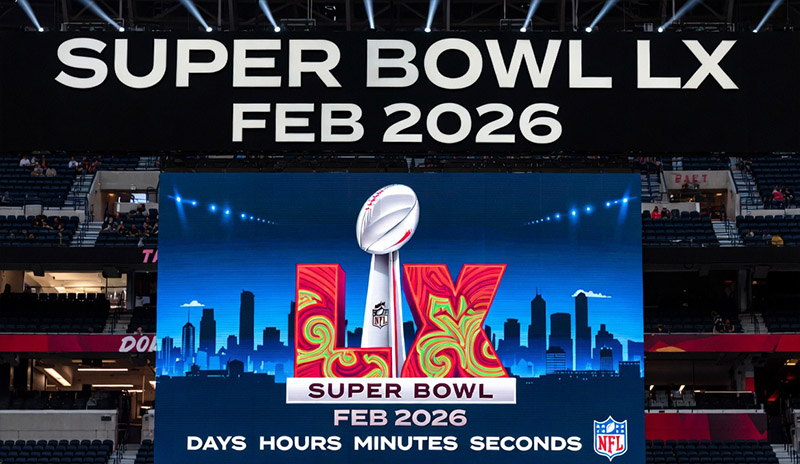
Super Bowl LX Social Media Analysis: When Entertainment Eclipsed the Game
The Seattle Seahawks may have defeated the New England Patriots 29-13 in Super Bowl LX on Sunday, but according to Onclusive’s comprehensive social media listening insights and media monitoring analysis, it was Bad Bunny’s halftime show that truly won the night.
From the opening ceremony through the final whistle, Super Bowl LX generated over 5,254,250 conversations on social media and 382,740 mentions in traditional media (press, television, and radio). This data, collected using Onclusive’s advanced media monitoring and social listening tools, reveals striking insights about what truly captures audience attention during America’s biggest sporting event.
Key takeaways: Super Bowl LX social media analysis
For PR and communications professionals:
- Entertainment drives Super Bowl engagement more than athletics – The halftime show’s 36% share of total conversation suggests brands should consider entertainment value alongside sports performance when planning activations.
- Political polarization is measurable and strategic – The stark sentiment divide (45% positive vs. 5.3% negative) and counter-programming’s 34% underperformance demonstrate how cultural events increasingly serve as political flashpoints. Brands must navigate these divisions carefully.
- Early release vs. game-day impact: both work – Different brands dominated pre-game (Bud Light 13.13%) versus during-game (Pokémon 13.20%) periods, indicating multiple viable approaches to Super Bowl marketing investment.
- Sponsorship integration multiplies impact – Apple Music’s 37.09% brand mention share directly resulted from halftime show sponsorship, demonstrating the value of strategic integration over standalone advertising.
- Celebrity mentions eclipse athletic performance – Bad Bunny’s 55.68% share of personality mentions versus MVP Kenneth Walker III’s 1.60% reveals the power of entertainment value in driving social conversation.
For marketers:
- Quality sentiment can outweigh conversation volume – Film trailers generated 17x fewer mentions than brand ads but achieved higher positive sentiment (Disclosure Day: 86%), proving targeted enthusiasm matters.
- Multi-day conversation building pays off – Pre-release strategies (Bud Light, Xfinity, Pringles) sustained attention across multiple news cycles rather than concentrating on game-day only.
- Nostalgia and cultural relevance drive sharing – Top performers (Pokémon’s 30th anniversary, Xfinity’s Jurassic Park reunion, Lay’s family farming story) tapped into emotional storytelling and cultural touchstones.
For Social media professionals:
- Peak moments are predictable – The 875,000-mention spike during Bad Bunny’s performance indicates when to maximize real-time engagement and content deployment.
- Counter-narratives generate significant engagement – Despite failing to match mainstream attention, TPUSA’s counter-programming still generated 1.23 million mentions, demonstrating the power of alternative positioning.
- Sentiment analysis reveals audience segmentation – Identical content (Spanish lyrics, Latino identity) generated “unifying” and “celebration” keywords for some audiences while triggering “not American” and “boycott” responses from others.
The halftime show phenomenon: 36% of all conversation
While MVP Kenneth Walker III delivered a dominant defensive performance and Sam Darnold completed one of the NFL’s greatest comeback stories, the data tells a different narrative about audience engagement.
Bad Bunny’s halftime performance generated 1.87 million mentions, accounting for 36% of all Super Bowl-related conversation. To put this in perspective:
- First two quarters of gameplay: 1.15 million mentions
- Third and fourth quarters: 1.55 million mentions
- Halftime show alone: 1.87 million mentions
The peak conversation moment occurred during the middle of Bad Bunny’s performance, with 875,000 mentions in a single spike, far surpassing any moment during actual gameplay.
What dominated the conversation?
Among 100 concepts analyzed, here’s how share of voice broke down on February 8:
| Super Bowl LX | 23,23% |
| Bad Bunny | 17,95% |
| Counterprogrammed halftime show | 15,35% |
| Halftime Show | 13,81% |
| Seahawks | 5,92% |
| Patriots | 5,86% |
| NFL | 5,62% |
| Green Day | 2,80% |
| Trump | 1,63% |
| SBLX | 1,48% |
| ICE | 1,00% |
| Woke | 0,94% |
| Coco Jones | 0,61% |
| Sam Darnold | 0,57% |
| Levis Stadium | 0,53% |
Super Bowl LX social media analysis: top 15 concepts
Notably, Bad Bunny alone received nearly as much conversation as both competing teams combined, underscoring the Super Bowl’s evolution from purely athletic competition to multifaceted cultural event.
Political polarization: two halftime shows, two Americas
Perhaps the most revealing aspect of this year’s data is the stark political divide reflected in competing halftime show narratives.
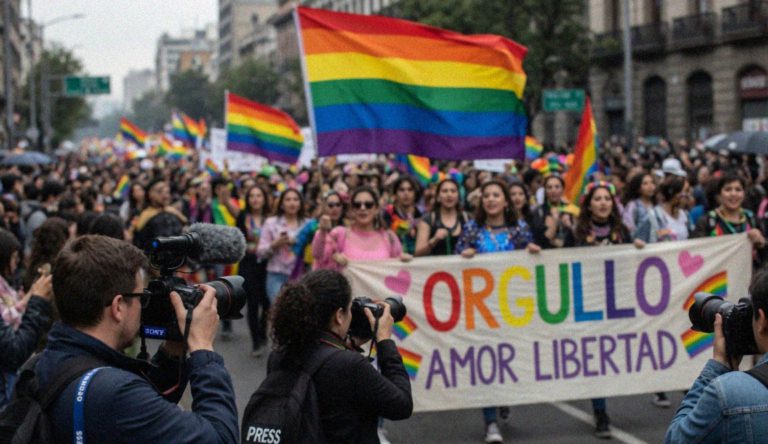
The official show: Celebration vs. exclusion
Bad Bunny’s performance generated 45% positive sentiment compared to just 5.3% negative. The keyword analysis reveals two completely different interpretations of the same event:
Positive keywords centered on:
- “Universal language”
- “Unifying”
- “Cultural”
- “Latino identity”
- “Celebration”
- “Global”
- “Not a protest show”
Negative keywords focused on:
- “Puerto Rican”
- “Not American”
- “Spanish”
- “Boycott NFL”
- “Foreign flags”
This 5.3% negative response, while small, was intense and organized, revealing how cultural symbols can simultaneously unite some audiences while alienating others.
The counter-programming experiment
Turning Point USA’s “All-American Halftime Show” featuring Kid Rock was positioned as a conservative alternative to the official broadcast. The results:
- TPUSA event: 1.23 million mentions
- Official halftime show: 1.87 million mentions
- Difference: 34% fewer mentions for the counter-event
The counter-show’s sentiment broke down as:
- 35.9% positive
- 9.7% negative
Interestingly, negative sentiment toward the TPUSA event centered on allegations of lip-syncing, with viewers noting Kid Rock’s mouth didn’t match the audio. Rumors spread that the show was pre-recorded in Atlanta, sparking jokes and ridicule across social platforms.
Adding another layer of complexity, media outlets shared images from Mar-a-Lago showing giant screens broadcasting the official SBLX halftime show rather than Kid Rock’s alternative, despite former President Trump calling Bad Bunny’s performance “AN ABOMINATION” and “Terrible.” These images prompted messages calling Republican leaders “hypocrites.”
Celebrity power: Showbiz dominates sports stars
When analyzing the most frequently mentioned personalities during Super Bowl LX (opening ceremony, game, and halftime show), entertainment figures dramatically outpaced athletes.
Top 15 most mentioned personalities:
| Bad Bunny | 55,68% |
| Green Day | 8,71% |
| Lady Gaga | 5,48% |
| Donald Trump | 5,44% |
| Ricky Martin | 2,10% |
| Cardi B | 2,07% |
| Coco Jones | 1,84% |
| Sam Darnold | 1,76% |
| Pedro Pascal | 1,66% |
| Kenneth Walker III | 1,60% |
| Mike Macdonald | 1,47% |
| Jessica Alba | 1,34% |
| Karol G | 1,28% |
| Drake Maye | 1,19% |
| Mack Hollins | 0,94% |
Super Bowl LX social media analysis: share of voice for the most frequently cited figures among 75 analyzed
Among 75 analyzed personalities with Onclusive media monitoring tools, the first athlete mentioned, quarterback Sam Darnold, ranked 8th. Kenneth Walker III, the game’s MVP with a dominant defensive performance, ranked 10th with just 1.60% share of voice.
Bad Bunny alone captured more than half (55.68%) of all personality-related mentions, demonstrating the overwhelming power of entertainment value in Super Bowl conversations.
Brand performance: Who broke through the noise?
Among 78 brands mentioned during Super Bowl LX, clear winners emerged both during the game and in the pre-game conversation period.
During-game brand leaders
Apple Music dominated with 37.09% of brand mentions, directly benefiting from its halftime show sponsorship. When audiences engaged with Bad Bunny’s performance, they inherently engaged with Apple Music’s brand presence.
Other top performers:
- Pokémon (13.20%): Celebrated the franchise’s 30th anniversary with a star-studded spot featuring Lady Gaga and BLACKPINK’s Jisoo. The “What’s Your Favorite?” campaign encouraged fan-focused interactive activations.
- Lay’s (8.02%): The emotional “Last Harvest” ad featured a father-daughter potato farming duo, prompting viewers to share personal family stories with posts like “Nothing tugs on my heart more than a good family story.”
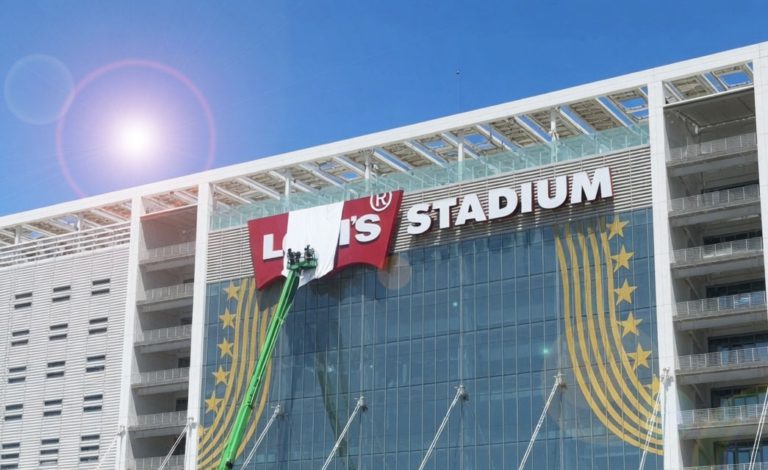
- Levi’s (7.68%): Secured strong engagement during the broadcast.
- Budweiser (7.56%): Evoked emotion, resilience, and American pride, with viewers calling it a “masterclass” and “best in years.”
- Dunkin’ (4.00%): “Good Will Dunkin’” parodied ’90s sitcoms as a “never-aired” pilot about inventing iced coffee, starring Ben Affleck, Jennifer Aniston, and Tom Brady.
- State Farm (2.32%): Pre-release of “Stop Livin’ on a Prayer” built hype with Jon Bon Jovi’s cameo and KATSEYE’s performance.
| Apple Music | 37,09% |
| Pokemon | 13,20% |
| Lay’s | 8,02% |
| Levi’s | 7,68% |
| Budweiser | 7,56% |
| Dunkin’ | 4,00% |
| State Farm | 2,32% |
| Novo Nordisk (Ozempic) | 2,06% |
| Bud Light | 1,74% |
| OpenAI | 1,46% |
| Pepsi zero sugar | 1,31% |
| Comcast/XFINITY | 1,31% |
| YouTube TV (Google / Alphabet) | 1,19% |
| DraftKings | 1,18% |
| Cadillac F1 | 0,97% |
Share of voice: Most mentioned advertising brands during the game
Pre-game strategy: Building multi-day buzz
Brands releasing ads early on social media saw different conversation leaders during the seven days before Super Bowl LX:
- Bud Light (13.13%): Pre-released January 30, featuring Peyton Manning, Post Malone, and Shane Gillis. Slapstick humor went viral, driving early memes.
- Comcast/Xfinity (10.14%): “Jurassic Park… Works” reunited Sam Neill, Laura Dern, and Jeff Goldblum. Pre-released February 2, nostalgia for the 1993 film sparked massive shares.
- Pringles (7.39%): Sabrina Carpenter starred in “Pringleleo,” building a “perfect man” from chips. Pre-released February 3, its campy vibe aligned with Carpenter’s persona.
- OpenAI (6.13%): “You Can Just Build Things” for Codex showcased AI enabling everyday creation. Pre-released amid AI hype, it sparked debates in the rivalry with Anthropic.
- State Farm (5.99%): Successfully generated conversation both pre-game and during the broadcast.
- Pokémon (5.42%): Built anticipation before the game.
- Anthropic (5.38%): Generated significant pre-game tech discussion.
- Blue Square (5.24%): Captured attention in the pre-game period.
| Bud Light | 13,13% |
| Comcast/XFINITY | 10,14% |
| Pringles | 7,39% |
| OpenAI | 6,13% |
| State Farm | 5,99% |
| Pokemon | 5,42% |
| Anthropic | 5,38% |
| Blue Square | 5,24% |
| DraftKings | 2,82% |
| Pepsi zero sugar | 2,49% |
| Squarespace | 2,38% |
| Budweiser | 2,16% |
| Uber Eats | 1,47% |
| Hims & Hers | 1,46% |
| Lay’s | 1,34% |
Share of voice for brand ads from February 2 to 8 on social media
This data reveals two viable Super Bowl advertising strategies: early release for sustained multi-day conversation versus game-day impact for concentrated attention.
Film trailers: Quality over quantity
While movie trailers generated significantly less volume than brand advertisements (45,000 mentions versus 770,000, a 17x difference), they achieved notably high positive sentiment.
Top film trailers by share of voice:
- Disclosure Day (Universal/Amblin): 28.21% – The spot aired just before kickoff, featuring a UFO emergence scene and live alien revelation. Viewers praised its “throwback summer blockbuster” vibe and mystery-shrouded marketing, evoking comparisons to Spielberg classics like War of the Worlds and Independence Day (which also launched via Super Bowl).
- The Mandalorian & Grogu (Lucasfilm/Disney): 26.08%
- Hoppers (Disney/Pixar): 13.05%
- Scream 7 (Paramount/Spyglass): 9.29%
- The Super Mario Galaxy Movie (Universal/Illumination/Nintendo): 7.46%
- Toy Story 5 (Disney/Pixar): 5.83%
| Disclosure Day (Universal / Amblin) | 28,21% |
| The Mandalorian & Grogu (Lucasfilm / Disney) | 26,08% |
| Hoppers (Disney / Pixar) | 13,05% |
| Scream 7 (Paramount / Spyglass) | 9,29% |
| The Super Mario Galaxy Mov (Univ / Ill /Nint) | 7,46% |
| Toy Story 5 (Disney / Pixar) | 5,83% |
| Minions 3 (Universal / Illumination) | 5,65% |
| Project Hail Mary | 1,73% |
| Michael (Lionsgate / Universal) | 1,36% |
| Cliff Booth | 1,34% |
Super Bowl LX social media analysis:share of voice of trailers during the game
Sentiment analysis
Disclosure Day achieved the highest positive sentiment at 86%, demonstrating that targeted, enthusiastic audiences can be as valuable as broad reach.
Conversely, the SuperGirl trailer received the least positive sentiment at only 50%, suggesting mixed reception to the DC property.
The lower overall volume but higher sentiment scores indicate that film trailers appeal to more specific, engaged fan communities rather than casual viewers, making them a different category of Super Bowl content entirely.
Conclusion: Super Bowl LX social media analysis
Super Bowl LX’s social media and traditional media data, analyzed comprehensively by Onclusive, reveals a fundamental shift in how audiences engage with America’s biggest sporting event. While the Seattle Seahawks’ 29-13 victory over the New England Patriots provided the athletic narrative, it was Bad Bunny’s halftime performance that commanded the digital conversation.
The numbers tell a clear story: entertainment eclipsed athletics. Bad Bunny’s 1.87 million mentions exceeded both halves of gameplay combined. His 55.68% share of personality mentions dwarfed even the game’s MVP. The halftime show’s 36% share of total Super Bowl conversation demonstrates that the event has evolved far beyond football.
But perhaps more revealing than the volume is what the sentiment analysis exposes about American culture. The same halftime show that generated 45% positive sentiment with keywords like “unifying” and “universal language” also triggered 5.3% intensely negative reactions focused on “not American” and “boycott NFL.” Even at Mar-a-Lago, where Trump called the show an “abomination,” screens broadcast Bad Bunny rather than the conservative alternative, exposing the gap between political rhetoric and actual viewing behavior.
For brands, the data offers multiple strategic pathways: Apple Music’s 37.09% dominance through halftime sponsorship integration, Pokémon’s game-day impact (13.20%), or Bud Light’s pre-game buzz-building (13.13%). The 17x difference in volume between brand ads and film trailers, despite trailers achieving higher positive sentiment, underscores that different objectives require different measurement frameworks.
What this analysis makes undeniable is that the Super Bowl is no longer primarily a football game with commercial breaks. It’s a cultural event where athletic competition, entertainment spectacle, brand storytelling, political expression, and celebrity power converge. The 5.25+ million social media conversations and 382,740 traditional media mentions reflect not just who won on the field, but who we are as a culture, what divides us, and what, despite everything, still brings us together to watch.
For communications professionals, marketers, and social media specialists, these insights demonstrate the critical importance of real-time media monitoring and sentiment analysis in understanding not just what audiences are saying, but what those conversations reveal about the cultural moment we’re living through.
About this Super Bowl LX social media analysis
This analysis was conducted using Onclusive’s advanced media monitoring and social listening tools, tracking conversations across social media platforms and traditional media channels (press, television, radio) from the Super Bowl LX broadcast start through post-game coverage. The study analyzed sentiment, share of voice, and engagement patterns across 100 distinct concepts, 78 brands, and 75 personalities related to Super Bowl LX.
FAQ: Super Bowl LX Social Media Analysis
Q: How much total social media conversation did Super Bowl LX generate?
A: Super Bowl LX generated over 5,254,250 conversations on social media from the opening ceremony through the end of the broadcast. Traditional media (press, television, radio) generated an additional 382,740 mentions. The data was captured on the morning of February 9, so the figures from the Super Bowl LX Social Media Analysis may change.
Q: Did the halftime show really get more attention than the game itself?
A: Yes. The halftime show generated 1.87 million mentions (36% of total conversation), while the first two quarters generated 1.15 million mentions and the final two quarters generated 1.55 million mentions. The halftime show received more mentions than either half of gameplay.
Q: What was the peak moment of social media conversation?
A: The peak occurred during the middle of Bad Bunny’s halftime performance, with 875,000 mentions in a single spike.
Q: How did the counter-programmed TPUSA halftime show perform?
A: Turning Point USA’s “All-American Halftime Show” generated 1.23 million mentions, approximately 34% fewer than the official halftime show’s 1.87 million mentions. It achieved 35.9% positive sentiment and 9.7% negative sentiment, with negative reactions primarily focused on alleged lip-syncing by Kid Rock.
Q: What sentiment did Bad Bunny’s halftime show receive?
A: Bad Bunny’s performance generated 45% positive sentiment compared to 5.3% negative. Positive keywords included “universal language,” “unifying,” “cultural,” and “celebration,” while negative keywords centered on “not American,” “Spanish,” and “boycott NFL.”
Q: Which brand performed best during the game?
A: Apple Music dominated with 37.09% of brand mentions among 78 brands analyzed, directly benefiting from its halftime show sponsorship. Among traditional advertisers, Pokémon led with 13.20%, followed by Lay’s (8.02%) and Levi’s (7.68%).
Q: Did pre-game ad releases perform differently than game-day ads?
A: Yes. Different brands led in different time periods. Bud Light dominated pre-game conversation (13.13%) while Pokémon led during the game (13.20%), suggesting both early-release and game-day strategies can be effective.
Q: How did film trailers perform compared to brand ads?
A: Film trailers generated significantly less volume (45,000 mentions vs. 770,000 for brands, 17x fewer) but achieved higher positive sentiment. Disclosure Day led trailers with 28.21% share of voice and 86% positive sentiment.
Q: Who was mentioned more: athletes or celebrities?
A: Entertainment personalities dramatically outpaced athletes. Bad Bunny captured 55.68% of personality mentions. The first athlete mentioned, quarterback Sam Darnold, ranked 8th (1.76%), while game MVP Kenneth Walker III ranked 10th (1.60%).
Q: What does this data mean for Super Bowl advertising strategy?
A: The data reveals that entertainment value drives engagement more than athletics, multiple advertising strategies can succeed (pre-release vs. game-day), sponsorship integration multiplies impact beyond standalone ads, and brands must carefully navigate increasing political polarization around cultural content.