The defining finding from Onclusive’s Brand Influence Rank 2026 is this: technology brands influence every position in the global top 10. YouTube leads with a Global Media Influence Score of 328. Google follows at 306. Instagram, Facebook, LinkedIn, Apple, Amazon, Microsoft, TikTok, and ChatGPT complete the group. There is not one automotive brand, one luxury house, one consumer goods company, or one financial institution in this tier.
For a PR director at a bank, a communications VP at a pharmaceutical group, or a brand manager at a retail chain, the instinctive reaction is often the same: we cannot compete with this. We are not YouTube. We do not have billions of daily users. We are not the subject of AI regulation debates.
That reaction, while understandable, misses what the data actually says.
The Brand Influence Rank 2026 is built on Onclusive’s proprietary Global Media Influence Score, combining a Media Score and a Social Media Score across 100 brands analysed over 12 months. It confirms that technology brands influence the top tier but also reveals precisely why that dominance exists, exactly where it breaks down, and which non-tech brands have found ways to compete at levels that no advertising spend or brand recognition survey would predict.
Technology brands influence the top 10 through structural mechanisms, not purely through communications investment. Understanding those mechanisms is the first step to identifying which elements of the model are reproducible – and which levers your own brand, in any sector, can activate right now.
Technology brands influence the top 10 not because they outspend everyone else in communications, but because their infrastructure generates high-quality, high-volume, self-reinforcing coverage simultaneously across every channel. Understanding that architecture is the first step to building toward it.Onclusive Brand Influence Rank 2026 |
I. How technology brands influence the full Global Media Influence Score top 10
The extent to which technology brands influence the top of the 2026 ranking is measurable across every score component. Understanding the data precisely – rather than treating tech dominance as a single monolithic fact – reveals a more actionable picture for communications professionals in all sectors.
| Brand Influence Rank 2026 – Global Media Influence Score (top 17) | |||||
| Data: Feb 25, 2025 – Jan 26, 2026 | |||||
| Rank | Brand | Sector | Media Score /200 | Social Score /200 | Global Score |
| 1 | YouTube | Digital platform | 137 | 191 | 328 |
| 2 | Technology | 136 | 170 | 306 | |
| 3 | Digital platform | 192 | 104 | 296 | |
| 4 | Digital platform | 186 | 79 | 265 | |
| 5 | Digital platform | 74 | 146 | 220 | |
| 6 | Apple | Technology | 104 | 94 | 198 |
| 7 | Amazon | Technology / retail | 66 | 123 | 189 |
| 8 | Microsoft | Technology | 38 | 124 | 162 |
| 9 | TikTok | Digital platform | 70 | 81 | 151 |
| 10 | ChatGPT | AI / technology | 27 | 108 | 135 |
| ► Ranks 11–17: first non-tech brands entering the competitive zone | |||||
| 11 | Netflix | Streaming / tech | 41 | 78 | 119 |
| 12 | NVIDIA | Technology | 27 | 91 | 118 |
| 13 | Tesla | Automotive / tech | 69 | 49 | 118 |
| 14 | Disney | Entertainment | 40 | 64 | 104 |
| 15 | Mercedes-Benz | Automotive | 9 | 29 | 102 |
| 16 | L’Oréal | Consumer goods | 15 | 95 | 101 |
| 17 | Toyota | Automotive | 14 | 69 | 98 |
| Source: Onclusive Brand Influence Rank 2026 | Global Media Influence Score = Media Score + Social Score | Scale 4–328 | |||||
Global Media Influence Score ranges from 4 (least influential) to 328 (most influential, YouTube 2026). Media Score and Social Score are each out of 200.
The Global Media Influence Score of the 10th-placed brand, ChatGPT at 135, already sits more than 15 points ahead of Netflix at rank 11 (119). That is a structural step-change, not a marginal difference. Below rank 14, scores compress significantly: Mercedes-Benz at 102, L’Oréal at 101, and Toyota at 98 are separated from each other by just 4 points in total.
Outside the top 10, competition between sectors is far tighter
It means that outside the top 10, where technology brands’ influence is structurally concentrated, the competitive landscape across sectors is far tighter than the headline story implies. A financial services brand at rank 39 with a Global Score of 56 sits within a few points of a luxury brand, an automotive company, and a consumer goods manufacturer. The most operationally relevant influence gap for non-tech brands is not the one between their brand and YouTube but the one between their brand and the best performer in their own sector.
8 of the top 10 are AI-native or AI-driven
A secondary dimension of how technology brands influence the top 10 is the AI concentration effect. Eight of the 10 brands are either AI-native or have positioned artificial intelligence at the centre of their business strategy. The AI investment wave of 2025 generated simultaneous coverage spikes across financial, regulatory, trade, and mainstream press for these brands – creating a temporary but powerful amplification of technology brands’ influence across multiple editorial categories at once.
II. The three structural mechanisms behind technology brands’ influence advantage
Understanding why technology brands influence the top 10 requires identifying the specific mechanisms at work. There are three – and only one of them has any direct equivalent outside the technology sector.
Mechanism 1: Platform-as-media presence
The most powerful driver of technology brands’ influence in this ranking is also the least replicable: YouTube, Instagram, Facebook, and TikTok are simultaneously the subject of editorial coverage and the infrastructure through which media content is created, distributed, and consumed. A journalist writing about a political speech embeds the YouTube video. A feature article on social media trends links to an Instagram post. A tech review cites a TikTok clip. In each case, the brand receives a media mention as a structural by-product of the article’s own production process – with no communications effort.
This passive accumulation of media mentions inflates Media Scores in a way that is structurally unavailable to non-platform brands. Instagram holds the highest Media Score in the entire top 10 at 192/200 – not because its communications team generates exceptional press coverage, but because its content is embedded in and referenced by the mainstream editorial ecosystem continuously. Communications teams benchmarking their own Media Scores against these platforms should account for this structural inflation: the mechanism is not comparable to earned media in the conventional sense.
Mechanism 2: Narrative gravity – the AI regulatory amplification loop
For Microsoft, Google, and ChatGPT, the AI governance narrative created a self-reinforcing coverage loop across 2025. Every regulatory proceeding, every Congressional hearing, every competitive product launch, and every employment anxiety story pulled these brands back into mainstream press as reference points for the AI debate. This is what drives technology brands’ influence beyond what their communications budgets alone would produce: their brand names have become attached to topics so consequential that coverage of those topics automatically generates brand coverage as an output.
This mechanism has a non-tech equivalent – but it requires genuine category leadership, not communications investment alone. A brand that is genuinely central to a major regulatory, economic, or societal debate can capture a version of this effect. Jamie Dimon at J.P. Morgan demonstrates this most clearly among non-tech brands: consistent macro commentary attaches a financial services brand to the same high-reach editorial category that drives technology brands’ influence in the AI space.
Mechanism 3: Dual-channel simultaneity
YouTube and Google hold the two highest Global Media Influence Scores in the ranking because they achieve high scores on both the Media Score and Social Score simultaneously, creating a self-reinforcing loop that neither channel can generate alone. For most brands – tech or non-tech – Media Score and Social Score peak separately. Instagram’s 192 Media Score is paired with a Social Score of only 104. Microsoft’s Social Score of 124 sits alongside a Media Score of just 38.
For non-tech brands, the strategic question is not isn’t reall how to replicate dual-channel dominance from a standing star but rather which dimension currently represents the larger underperformance gap – and which lever is most accessible given the sector’s structural constraints.
III. Where technology brands’ influence advantage breaks down: the sentiment ceiling
Technology brands’ influence at the top of the ranking is real. But it is not unconditional. The data reveals a precise pattern that non-tech communications teams should study closely: several of the most technically powerful platforms in the ranking are being structurally constrained by one of the most accessible levers available to any brand – positive media sentiment.
Regulatory pressure as an influence score cap
Positive media sentiment across the top 10 varies significantly, and the variance is directly traceable to regulatory and reputational pressures:
| Brand Influence Rank 2026 – Positive media sentiment: all top 10 brands | |||
| Positive media sentiment operates as a multiplier in the Global Media Influence Score methodology. | |||
| Brand | Rank | Positive media sentiment | Sentiment signal / key driver |
| YouTube | #1 | 76% | Highest in top 10 – structural positive coverage, no regulatory overhang |
| #5 | 70% | Quality over volume – B2B credibility, no content moderation controversy | |
| #3 | 63% | Strong despite regulation debates; social media / mental health coverage | |
| ChatGPT | #10 | 63% | AI governance & ethics debates; job displacement coverage; contested narrative around AGI risk |
| Microsoft | #8 | 62% | More admiration than controversy; AI narrative generates positive framing |
| Amazon | #7 | 62% | Solid; logistics, Prime, AWS drive positive coverage despite labour scrutiny |
| Apple | #6 | 58% | Constrained by antitrust proceedings and EU DMA fines |
| TikTok | #9 | 58% | Geopolitical & data privacy ceiling; U.S. ban threat throughout 2025 |
| #2 | 53% | Antitrust cases and DMA proceedings limit sentiment conversion | |
| #4 | 51% | Lowest confirmed media sentiment – governance, privacy, content moderation | |
Facebook’s 51% positive media sentiment is the lowest in the top 10. Google sits at 53%. Both brands generate extraordinary mention volumes, yet their sentiment floors – driven by antitrust proceedings, Digital Markets Act fines, data privacy controversies, and platform governance debates – apply a structural cap to their Global Media Influence Scores regardless of coverage volume.
This is the critical insight for non-tech brands: technology brands’ influence advantage at the top of the ranking is partially offset by a sentiment disadvantage that non-tech brands with strong narrative discipline can structurally outperform. The most financially powerful platforms in the world are operating at a significant sentiment discount. A consumer goods brand with 83% positive media sentiment converts its coverage into influence far more efficiently than a platform with 51%.
The Uber extreme: when sentiment destroys the technology brands’ influence model
The most dramatic illustration sits at rank 18. Uber, a technology brand by most definitions, holds a positive media sentiment of just 23% – the lowest across all 100 brands in the entire ranking. Its social mention volume is substantial at 22.5 million. Its LinkedIn presence is solid. Yet its Media Score of 11/200 – a direct result of structurally hostile press coverage around driver labour conditions, regulatory battles, pricing controversies, and gig economy debates – caps its Global Score regardless of any investment in coverage volume.
Uber is the clearest proof that technology brands’ influence is not guaranteed by technology sector membership. The sector provides structural advantages. It does not override the sentiment multiplier.
IV. The non-tech brands that are genuinely competing with technology brands’ influence
The headline narrative of technology brands’ influence dominance obscures an important secondary story: several non-tech brands achieve influence scores that are structurally competitive with mid-tier technology brands – and they do it through completely different mechanisms.
L’Oréal #16: the highest-sentiment model in the ranking
L’Oréal’s Global Media Influence Score of 101 makes it the highest-ranked consumer goods brand in the ranking, placed above luxury leaders, automotive giants, and financial institutions. The mechanism behind this position has nothing to do with platform infrastructure or AI narratives. It has everything to do with sentiment quality.
L’Oréal holds a positive media sentiment of 83%, the highest by a significant margin across all 100 brands analysed – higher than any brand in the technology brands’ influence top 10. Its positive LinkedIn sentiment of 79% is also the highest in the entire study, reflecting professional admiration for its positioning around product innovation, scientific research, sustainability, and diversity and inclusion. Its LinkedIn average engagement is the highest overall. L’Oréal demonstrates that a brand with lower raw mention volumes than a technology platform can achieve a competitive influence score by maximising the quality of every mention it generates.
Louis Vuitton #19: the premium narrative model
Louis Vuitton’s 70% positive media sentiment is among the strongest outside the top 10, built on desirability, exclusivity, and cultural influence. Its LinkedIn positive sentiment of 71% and strong average engagement reflect professional admiration for its marketing excellence. Bernard Arnault’s visibility as LVMH chairman provides a CEO amplification effect that mirrors, at smaller scale, the dynamic visible in the technology brands’ influence top 10 – influence generated by an executive voice rather than the brand’s own direct communications activity.
Chanel #42: social-amplified influence for luxury
Chanel’s rank 42 position reflects a Social-amplified media architecture: ambassador communities and aspiration-driven organic content, particularly across Asian markets, generate social volume that crosses into editorial coverage. Its positive media sentiment of 81% is exceptional for a brand at this ranking tier. Chanel demonstrates that the social-first influence architecture used by technology brands like TikTok and Tesla is also accessible to heritage luxury brands, provided the brand’s cultural equity is strong enough to sustain organic community conversation at scale.
Automotive brands: coverage without conversion
Toyota at rank 17 and Mercedes-Benz at rank 15 reveal the challenge facing automotive brands in competing with technology brands’ influence. Toyota generates 5.4 million press mentions – yet a positive media sentiment of 57% limits the conversion of that volume into influence score. Mercedes operates with a positive media sentiment of 54%, reflecting EV transition challenges, profitability pressures, and premium automotive sector headwinds.
Both cases illustrate a pattern common across sectors that rely on product launches and financial results for their primary coverage triggers: high brand recognition produces media coverage, but the dominant editorial themes are frequently externally driven and contested, making sentiment management structurally harder than in sectors where the narrative is more controlled.
V. Lesson 1: Sentiment quality is the great equalizer in brand influence
The most accessible lever available to non-tech communications teams seeking to narrow the gap with technology brands’ influence is also the most frequently underinvested in: the quality of positive sentiment in mainstream press coverage.
Three pairs of brands in the ranking make this argument empirically:
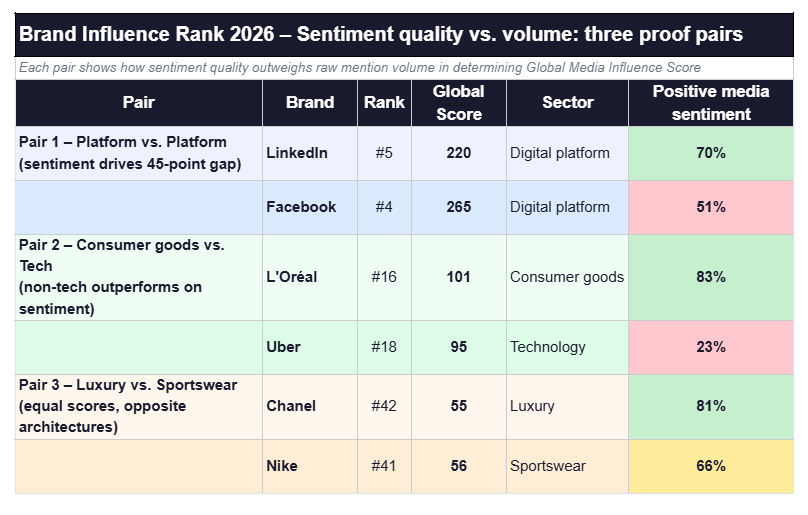
LinkedIn generates far lower raw mention volumes than Facebook, yet sits just 45 points behind it in Global Score – and 30 points ahead of Apple. The gap is almost entirely sentiment-driven: LinkedIn’s 70% positive media sentiment converts coverage efficiently into influence; Facebook’s 51% wastes a large proportion of its mention volume on coverage that applies a negative drag to the sentiment multiplier.
L’Oréal achieves its position with 83% positive media sentiment on significantly lower mention volumes than Uber. Uber generates high social volume and a solid LinkedIn presence but is structurally capped at 23% positive media sentiment.
Chanel and Nike sit just one rank apart with near-identical Global Scores, built on entirely different architectures. Nike generates 13.4 million social mentions and 1.7 million press mentions. Chanel operates with lower volumes but achieves equivalent brand influence through 81% positive media sentiment and an engaged luxury community.
What this means for communications strategy
Sentiment is not a soft metric. In the Global Media Influence Score methodology, positive sentiment operates as a multiplier: the same volume of press mentions produces systematically higher scores at 75% positive sentiment than at 50%. Moving positive media sentiment from 55% to 70% on an existing mention volume produces a larger improvement in Global Media Influence Score than doubling mention volume at the current sentiment level.
For non-tech brands: if your current positive media sentiment sits below 60%, improving it is a higher-priority investment than growing coverage volume. Report sentiment as a primary KPI alongside mention volume, reach, and share of voice.
VI. Lesson 2: Know your influence typology and play your structural game
One of the core findings from the Brand Influence Rank 2026 is that technology brands’ influence is not built through a single uniform architecture. Six distinct influence profiles emerge across the 50 most influential brands. For non-tech brands, identifying the profile that best describes their current position is the foundation for setting appropriate targets and selecting the right communications levers – rather than attempting to replicate the mechanisms behind technology brands’ influence that are structurally inaccessible.
The six influence profiles mapped to non-tech sectors
| Brand Influence Rank 2026 – Six influence profiles (typology matrix) | ||||
| Identify your brand’s primary profile → select structurally comparable benchmarks → prioritise communications levers | ||||
| Profile | Definition | Ranking examples | Sector applicability | Strategic implication for non-tech brands |
| DUAL DOMINANT | High on both Media Score and Social Score simultaneously. Self-reinforcing loop: each channel continuously amplifies the other. | YouTube #1, Google #2 | Digital platforms with platform-as-media infrastructure | The long-term aspiration for all brands. Currently accessible only to platforms whose content is simultaneously the subject and vehicle of media distribution. Use as benchmark, not starting point. |
| MEDIA-AMPLIFIED SOCIAL | Press coverage leads, social conversation follows. The majority pattern. Earned media is the primary engine. | Apple #6, L’Oréal #16, Disney #14, Walmart #24 | Consumer goods, retail, automotive, financial services, pharma | Sentiment management in mainstream press is the decisive lever. High-quality editorial converts into organic social with a lag. Most non-tech brands operate in this profile. |
| SOCIAL-AMPLIFIED MEDIA | Social conversation precedes and drives editorial coverage. The disruptor pattern. | Tesla #13, TikTok #9, Nike #41, Chanel #42 | Luxury, lifestyle, sportswear, entertainment | Natural architecture for brands with strong organic social equity. Risk is symmetrical: negative moments escalate to press as fast as positive ones. Monitor social-to-media amplification thresholds continuously. |
| B2B-ANCHORED | Influence built through professional channels. LinkedIn is the primary arena. Low consumer social visibility. | Microsoft #8, Siemens #21, SAP #27, Accenture #26 | Technology (B2B), professional services, energy, industrial | Consumer social metrics are irrelevant benchmarks. CEO visibility in specialist press, LinkedIn reach, and professional engagement quality are the decisive levers. |
| SENTIMENT-CONSTRAINED | High mention volume, structurally low positive sentiment. Score is capped by negative coverage regardless of volume investment. | Facebook #4, Uber #18, Wells Fargo #37, Morgan Stanley #44 | Financial services, gig economy platforms, regulated industries | Volume investment produces diminishing returns. Address the underlying issues generating negative commentary first. Communications investment is ineffective until the sentiment deficit narrows. |
| CEO-CARRIED | Brand influence disproportionately generated by the CEO’s personal media footprint rather than the brand’s own communications activity. | Tesla / Musk, ChatGPT / Altman, Facebook / Zuckerberg | Any sector where the CEO has achieved personal media scale | Real influence at scale, but structural dependency: a CEO reputational event directly threatens the brand score. Diversifying influence drivers beyond the executive personality is the primary strategic priority. |
| Source: Onclusive Brand Influence Rank 2026 | Typology based on analysis of top 50 brands by Global Media Influence Score | ||||
Benchmarking within your typology
The strategic value of profile identification is benchmarking precision. A B2B-anchored brand should measure its performance against Siemens, SAP, and Accenture – not against YouTube or Nike. A Sentiment-constrained brand should track its sentiment improvement trajectory against Wells Fargo or Morgan Stanley – not against L’Oréal. Benchmarking against structurally incomparable brands, including against the technology brands’ influence leaders, produces misleading conclusions and misdirected investment.
VII. Lesson 3: CEO visibility as a non-tech brand influence amplifier
The CEO Media Score, one of the three core metrics in Onclusive’s Brand Influence Rank 2026, reveals a consistent pattern among non-tech brands: those that achieve the strongest influence scores within their sectors tend to benefit from meaningful CEO or senior executive visibility. Those whose scores lag within their sector tend to operate with very low executive public presence.
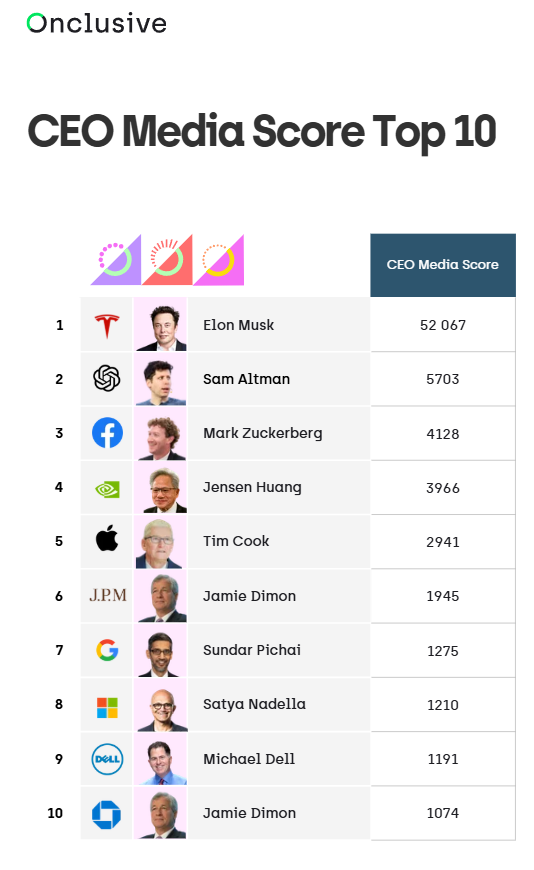
The Jamie Dimon proof case: macro authority as a non-tech influence model
Jamie Dimon appears twice in the CEO Media Score top 10: sixth place for J.P. Morgan (CEO Media Score of 1,945) and tenth place for Chase (1,074). The gap between these two scores – for the same individual making the same public statements – is explained entirely by editorial context. J.P. Morgan is the name that appears in financial press, Bloomberg, Reuters, and the FT when Dimon speaks about macroeconomic risk, geopolitical uncertainty, or artificial intelligence. Chase appears in consumer press when coverage concerns retail banking products, where media intensity is lower.
The lesson is structural: the Macro Authority CEO model – attaching an executive voice consistently to the largest economic and policy debates beyond the brand’s own category – places a non-tech financial brand in the same CEO Media Score tier as Sam Altman and Jensen Huang. It is the most clearly reproducible non-tech path to competing with the CEO visibility component of technology brands’ influence. But it requires genuine consistency: sector-specific commentary alone is insufficient. The coverage multiplier only activates when the CEO’s voice is recognised as relevant to cross-category debates.
Where automotive brands leave influence on the table
Toyota CEO Koji Sato and Mercedes-Benz CEO Ola Källenius both maintain low public profiles across media and social channels. In a sector where EV transition narratives, supply chain challenges, and emissions regulation are dominant editorial themes, both brands are missing an opportunity to attach an executive voice to those debates – and in doing so, to generate cross-press coverage that elevates brand influence scores even when the underlying topic is not product-specific.
The contrast with how technology brands’ influence is built through CEO visibility is significant: in the tech sector, Jensen Huang (NVIDIA) and Satya Nadella (Microsoft) have become inseparable from the AI infrastructure narrative, generating specialist and financial press coverage that elevates their brands’ scores continuously. The automotive equivalent – a CEO who credibly owns the energy transition narrative – remains largely absent from the ranking’s top CEO Media Scores.
The right CEO model for non-tech brands: Brand Diplomat over volume maximisation
The most strategically instructive CEO model in the ranking for non-tech communications teams is Tim Cook. His CEO Media Score of 2,941 is significantly lower than Elon Musk’s 52,067 or Sam Altman’s 5,703. But Apple’s 77% positive sentiment on LinkedIn is the highest of any brand in the entire top 10. Cook achieves this by keeping his public presence tightly constrained to brand-relevant themes. Every press mention linked to Cook is almost entirely about Apple – products, policy, earnings, supply chain. This brand-constrained approach sacrifices raw mention volume for per-mention quality.
For most non-tech CEOs, the Cook model – strategic selectivity over volume maximisation – is both more achievable and more likely to generate net-positive brand influence outcomes than attempting to replicate the topic-driven dominance of an Altman or the platform-driven amplification of a Zuckerberg.
→ Download the Brand Influence Rank 2026 report
VIII. Five actions non-tech communications teams should take to build brand influence right now
The data from the Brand Influence Rank 2026 translates into five specific, measurable actions for communications and PR teams seeking to build brand influence in sectors where technology brands’ structural advantages are not available.
01 – Benchmark within your typology, not against technology brands’ influence leaders
Identify which of the six influence profiles best describes your brand’s current architecture. Use that profile to select your primary benchmark competitors. If you are a B2B-anchored brand, your KPI baseline is Siemens, SAP, or Accenture – not YouTube or Google. If you are a Media-amplified social brand, L’Oréal’s sentiment-driven model provides a more instructive benchmark than Apple’s consumer media footprint. Setting targets against technology brands’ influence leaders produces goals that either cannot be achieved or do not reflect the actual levers available to your communications team.
02 – Treat sentiment as a primary scored metric, not a qualitative impression
Measure your positive media sentiment as a percentage and track it monthly. Set a target range based on the best-in-sector performers in the ranking. If your current positive media sentiment is below 60%, prioritise sentiment improvement over volume growth. The multiplier effect of moving from 55% to 70% on your existing mention volume produces a larger improvement in Global Media Influence Score than doubling mention volume at the current sentiment level. Report sentiment as a primary KPI alongside mention volume, reach, and share of voice.
03 – Identify and address your sentiment constraints specifically
Low sentiment is never generic. It is driven by specific narrative threads – regulatory scrutiny, product controversies, labour practices, pricing debates – that recur persistently across press coverage. Map the top five negative narrative drivers in your press coverage over the past 12 months. For each one, determine whether the constraint is addressable through communications (incorrect framing correctable through better earned media placement) or structural (a genuine business issue generating justified criticism). Structural constraints require addressing the underlying issue first. Communications-addressable constraints require a targeted narrative strategy and consistent placement effort against each identified driver.
04 – Build CEO brand influence around two or three owned topic territories
Identify the one or two topics adjacent to your sector currently generating the highest editorial coverage volumes in mainstream press. For a financial services brand, that might be AI adoption and economic risk. For an automotive brand, energy transition and mobility infrastructure. For a consumer goods brand, sustainability and supply chain transparency. Position your CEO as a consistent, credible voice on those topics – not by maximising appearance frequency, but by ensuring every public statement reinforces a clear, brand-aligned perspective. Measure CEO Media Score monthly and track the sentiment quality of CEO-attributed coverage separately from overall brand coverage.
05 – Integrate brand influence measurement into your analytics stack
The Global Media Influence Score methodology combines Media Score, Social Score, sentiment multipliers, and CEO visibility into a single composite metric. For communications teams currently measuring media impact through mention volume and share of voice alone, this represents a significant expansion of measurement scope. The practical starting point is adding sentiment tracking, LinkedIn reach measurement, and CEO mention monitoring to your existing reporting framework. Onclusive Self Service Monitoring for mainstream media monitoring and Onclusive Social for social listening provide the data inputs required to track each component of brand influence. The goal is a single, integrated view of your cross-channel brand influence performance – not separate social and media reports that never connect.
The cover images were generated by a Gen AI tool for illustrative purposes
FAQ: Technology brands influence and what non-tech sectors can learn
1.Why does technology brands’ influence dominate the Brand Influence Rank 2026 top 10?
Technology brands’ influence at the top of the ranking reflects three structural advantages.
First, platform-as-media presence: YouTube, Instagram, Facebook, and TikTok are simultaneously the subject of editorial coverage and the channels through which media content is distributed – generating brand mentions passively as a by-product of third-party article production. Note that this structural dynamic inflates Media Scores for these platforms in a way that is not directly comparable to earned media for non-platform brands.
Second, the AI investment wave of 2025 amplified technology brands’ influence simultaneously across financial, regulatory, trade, and mainstream press, creating a concentration effect at the top. Third, several top-10 brands generate dual-channel dominance – high Media Score and high Social Score simultaneously – creating self-reinforcing amplification loops that continuously elevate their scores.
2.Can non-tech brands realistically compete with technology brands’ influence?
Not at the very top, where structural infrastructure advantages are decisive. But outside the top 10, competition across sectors is genuinely tight. L’Oréal at rank 16 outperforms several technology brands ranked below it. Chanel at rank 42 achieves a score comparable to Nike at rank 41 through entirely different mechanisms. The most relevant competitive lens for non-tech brands is within-sector benchmarking: which brand in your sector is achieving the highest Global Media Influence Score, and through what specific combination of sentiment quality, CEO visibility, and channel mix?
3.What is the single most important lever for non-tech brands to improve their brand influence score?
Among brands ranked 11 to 50, positive media sentiment is the metric with the highest leverage on Global Media Influence Score. L’Oréal’s 83% positive media sentiment converts its press coverage into brand influence far more efficiently than Facebook’s 51%, even though Facebook generates far higher raw mention volumes. For most non-tech brands, improving positive media sentiment from a current level of 55-60% to 70%+ represents the most achievable path to a meaningful brand influence score improvement within 12-18 months – provided the narrative drivers of negative coverage are specifically identified and addressed.
4.How does the brand influence typology help non-tech communications teams compete with technology brands’ influence?
The six-profile typology – Dual Dominant, Media-amplified social, Social-amplified media, B2B-anchored, Sentiment-constrained, and CEO-carried – provides a framework for identifying which communications levers are structurally available to a given brand, and which benchmarks are meaningful comparators. Attempting to build brand influence using the same mechanisms that drive technology brands’ influence at the top of the ranking is, for most non-tech brands, the wrong starting point. Identifying your primary profile is the first step to setting realistic, lever-appropriate communications targets.
5.What is the CEO visibility model that works best for building non-tech brand influence?
The data points to two relevant models. The Macro Authority model, demonstrated by Jamie Dimon at J.P. Morgan, builds brand influence by consistently attaching the CEO’s voice to macro-level topics – economic outlook, geopolitical risk, AI – that generate coverage in high-reach institutional press. This model produces the highest per-mention media impact because the publications involved carry more influence weight than regional or consumer press.
The Brand Diplomat model, demonstrated by Tim Cook, builds brand influence by keeping CEO public presence tightly constrained to brand-relevant themes, maximising sentiment quality of each mention at the cost of total mention volume. For most non-tech CEOs, the Brand Diplomat model is more sustainable and produces more predictable brand influence outcomes.
6. How should non-tech brands use the Brand Influence Rank to set their brand influence strategy?
The ranking provides three levels of strategic input.
First, sector benchmarking: identify where your brand sits relative to sector peers and which specific score components (Media Score, Social Score, sentiment, CEO mentions) represent the largest underperformance gaps.
Second, typology diagnosis: identify your primary influence profile and use it to select structurally comparable benchmarks rather than benchmarking against technology brands’ influence leaders.
Third, lever prioritisation: for each underperformance gap, identify the specific communications investment most likely to close it – sentiment improvement, CEO visibility activation, LinkedIn strategy, or earned media volume growth. The Brand Influence Rank 2026 provides the baseline. Onclusive’s monitoring tools provide the real-time tracking required to measure progress against it.