A platform at 20: what the figures from X Twitter statistics 2026 reveal
On March 21, 2026, the platform celebrates 20 years since first tweet.
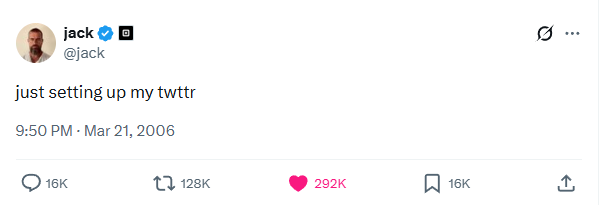
On March 21, 2006, Jack Dorsey sent the first message on a new internal platform built by a small team at podcasting startup Odeo: “just setting up my twttr.” The platform was co-founded by Dorsey, Noah Glass, Evan Williams and Biz Stone, and launched publicly in July 2006. Its defining constraint was radical: 140 characters, mirroring the length limit of an SMS text message.
The idea was deceptively simple: a public, real-time stream of short updates, visible to anyone. At South by Southwest in March 2007, Twitter’s first major public exposure, daily tweet volume tripled overnight from 20,000 to 60,000. Chris Messina proposed the hashtag (#) that same year.
By 2009, the platform was processing 50 million tweets per day. By 2010, it was central to the Arab Spring, confirming what no one had fully anticipated in 2006: that a 140-character constraint, applied at global scale, could reshape journalism, politics, crisis communication and public discourse in ways that no traditional media institution had achieved before.
Twenty years later, the platform sends 500 million posts per day and remains the world’s primary real-time information infrastructure, despite having changed its name, its owner, and much of its identity along the way.
- Twitter received its first surge of public attention at SXSW 2007.
- By 2012 it had surpassed 100 million monthly active users.
- By 2022 it was generating $4.4 billion in annual revenue.
- Then Elon Musk bought it for $44 billion, fired 80% of the staff, renamed it X, and set in motion one of the most dramatic transformations in the history of social media.
The X Twitter statistics 2026 tell a story of structural decline and partial stabilisation. The platform has not collapsed. It has lost casual users, shed advertisers, watched competitors gain ground, and navigated a crisis of information quality, but it retains a core audience of over 388 million monthly users, an advertising reach of 557.5 million, and an unmatched position as the world’s primary real-time news platform.

I. Demographics: who uses X in 2026 ?
1. Self-declared monthly use: trend over time
X’s global footprint is best understood through three distinct lenses: self-declared monthly usage (how many internet users say they opened the app at least once in the past month), platform ranking against competitors, and the geographic and demographic breakdown of its active base.
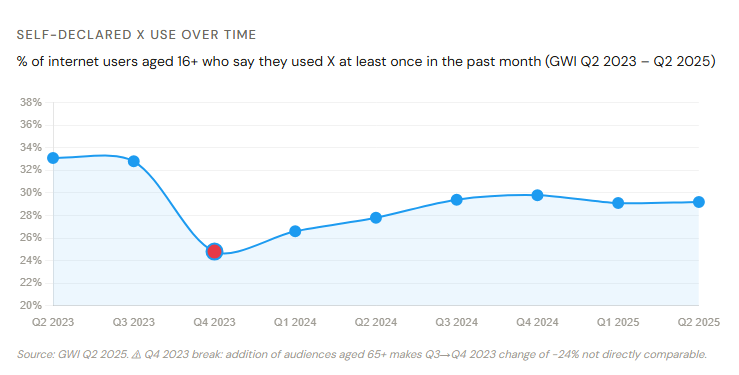
The trend line tells a story of shock and stabilisation. Between Q2 and Q3 2023, self-declared use was already edging down (-0.9%). The sharp fall to 24.8% in Q4 2023 reflects a methodology change (inclusion of 65+ audiences) rather than a genuine user collapse, the data series is not continuous across this break. From Q1 2024 onwards, the picture stabilises: X has held between 29% and 30% for six consecutive quarters, suggesting the platform has found a floor after the post-Musk turbulence.
In absolute terms, 29.2% of global internet users aged 16+ say they used X in the past month as of Q2 2025. That translates to a substantial audience, but one that has clearly plateaued rather than growing.
Key reading for PR and communications professionals: The stabilisation of X’s user base at ~29% is strategically important. The platform has not collapsed. It has lost casual or marginal users and retained its core, a more engaged, more intentional audience that uses it primarily for news, information and public discourse.
2. X vs all major platforms: where does it rank?
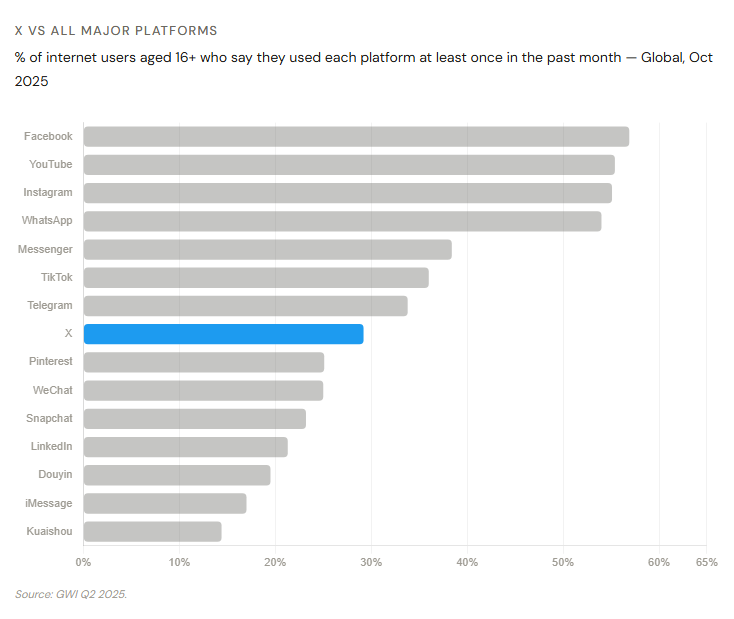
In the global platform ranking, X sits 8th at 29.2%, well behind the dominant Meta ecosystem (Facebook 56.9%, Instagram 55.1%, WhatsApp 54.0%, Messenger 38.4%) and YouTube (55.4%). TikTok (36.0%) and Telegram (33.8%) have now clearly overtaken X. Pinterest (25.1%), WeChat (25.0%), Snapchat (23.2%) and LinkedIn (21.3%) trail behind.
The gap with Telegram (4.6 points) is striking: Telegram, born in 2013 as a messaging app, has grown its declared reach to near-parity with X, largely by attracting users seeking uncensored news channels and communities, precisely the audience X might have expected to retain.
3. X (Twitter) use by country
The geographic portrait of X is dramatically unequal. Nigeria leads the world at 80.7%, meaning more than 4 in 5 Nigerian internet users say they used X in the past month. Saudi Arabia (66.7%), Kenya (60.0%) and Turkey (58.7%) complete the top four, all markets with strong political, sports and news-driven Twitter cultures dating back to the Arab Spring and beyond.
The Global South and Middle East dominate the top positions: Indonesia (50.4%), South Africa (47.7%), UAE (46.7%), Mexico (45.6%), Thailand (45.4%) and Japan (44.0%) all far exceed the global average. The 29.2% worldwide figure masks an enormous variance, in some markets, X is a near-universal information tool; in others it is niche or negligible.
Western European markets cluster in the 16-22% range: France at 21.7%, Germany at 16.1%, Switzerland at 21.2%, Sweden at 21.1%. Russia shows no measurable data; China at 4.3% reflects its domestic alternatives. For European PR and communications professionals, this context matters: X remains a professional and media industry tool in these markets rather than a mass-market consumer platform.
The United States (30.9%) sits fractionally above the global average, a counter-intuitive finding given the platform’s American origins and its outsized role in U.S. political discourse. Japan (44.0%) is by far the most X-engaged major economy in the developed world, a position it has held for over a decade.
4. X (Twitter) use by age and gender
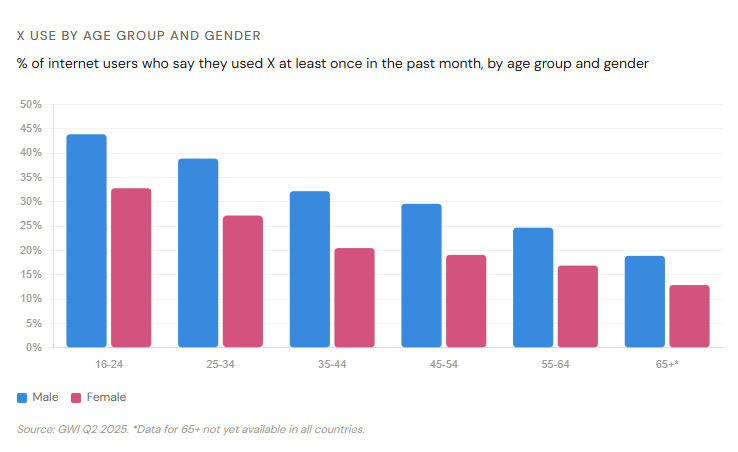
X is a significantly male-skewed platform at every age group, and across all demographics. The gender gap in self-declared usage runs at approximately 10-11 percentage points at every age band, from 16-24 (male 43.9% vs female 32.8%) to 65+ (male 18.9% vs female 12.9%). This gap does not narrow with age.
Usage declines linearly with age for both genders. The 16-24 male cohort (43.9%) is the most active, but the platform clearly fails to generate the same level of habitual engagement among women, a strategic consideration for brands targeting female audiences who may find better reach-efficiency on Instagram or Pinterest.
II. The most followed X accounts in the world
The ranking of X’s most-followed accounts has shifted considerably since 2022. The Elon Musk era has produced a notable concentration of influence at the very top, with the platform’s owner now holding the most-followed account by a wide margin.
Elon Musk (236.8M) leads by a margin of nearly 95 million over Barack Obama (119.2M). The lead is not organic in the traditional sense, Musk’s visibility on his own platform has been the subject of academic research examining possible algorithmic amplification (see Section 7). The top 40 encompasses six distinct categories that reveal X’s core value proposition: it is where politics, sport, entertainment and media intersect in real time.
Music and entertainment dominates by account count (16 accounts, 944M combined), but many of these accounts (Bieber, Perry, Swift) have seen flat or declining follower counts in recent years. The sport category (9 accounts, 518M combined, averaging ~57M per account) is remarkably consistent, no individual account dominates (with the exception of Cristiano Ronaldo), reflecting sport’s distributed fandom model.
Of note for social media listening professionals: BTS (@bts_twt) appears at position 30 with 46.9M followers, underscoring the continued relevance of K-pop fandom communities as drivers of volume, engagement and trending topics on X. Major news brands, CNN (61.5M), CNN Breaking (59.5M), The New York Times (53M), BBC Breaking (49.8M), collectively reaching over 223M followers, confirm X’s structural role as a distribution channel for breaking news.
| # | Account | Handle | Category | Followers |
| 1 | Elon Musk | @elonmusk | Politics/Tech | 236.8M |
| 2 | Barack Obama | @barackobama | Politics | 119.2M |
| 3 | Donald Trump | @realdonaldtrump | Politics | 110.8M |
| 4 | Narendra Modi | @narendramodi | Politics | 106.4M |
| 5 | Cristiano Ronaldo | @cristiano | Sport | 106.1M |
| 6 | Rihanna | @rihanna | Music | 96.6M |
| 7 | Justin Bieber | @justinbieber | Music | 90M |
| 8 | NASA | @nasa | Science/Tech | 89.9M |
| 9 | Katy Perry | @katyperry | Music | 85.5M |
| 10 | Taylor Swift | @taylorswift13 | Music | 79.2M |
| 11 | Lady Gaga | @ladygaga | Music | 70.8M |
| 12 | Kim Kardashian | @kimkardashian | Entertainment | 68.7M |
| 13 | YouTube | @youtube | Platform | 68.1M |
| 14 | Virat Kohli | @imvkohli | Sport | 66.2M |
| 15 | Bill Gates | @billgates | Tech | 62.7M |
| 16 | Ellen DeGeneres | @theellenshow | Entertainment | 62.6M |
| 17 | CNN | @cnn | News/media | 61.5M |
| 18 | X (official) | @x | Platform | 60.6M |
| 19 | CNN Breaking News | @cnnbrk | News/media | 59.5M |
| 20 | Neymar | @neymarjr | Sport | 58.7M |
| 21 | Selena Gomez | @selenagomez | Music | 58.6M |
| 22 | PMO India | @pmoindia | Politics | 58.2M |
| 23 | ESPN | @espn | Sport/media | 57.8M |
| 24 | The New York Times | @nytimes | News/media | 53M |
| 25 | UEFA Champions League | @championsleague | Sport | 52.6M |
| 26 | BBC Breaking News | @bbcbreaking | News/media | 49.8M |
| 27 | Real Madrid CF | @realmadrid | Sport | 49M |
| 28 | Justin Timberlake | @jtimberlake | Music | 48M |
| 29 | LeBron James | @kingjames | Sport | 48.1M |
| 30 | BTS (방탄소년단) | @bts_twt | Music/K-pop | 46.9M |
| 31 | FC Barcelona | @fcbarcelona | Sport | 46.5M |
| 32 | NBA | @nba | Sport | 46.2M |
| 33 | Shakira | @shakira | Music | 45.3M |
| 34 | Premier League | @premierleague | Sport | 45.0M |
| 35 | Amitabh Bachchan | @srbachchan | Entertainment | 44.9M |
| 36 | Akshay Kumar | @akshaykumar | Entertainment | 44.4M |
| 37 | Demi Lovato | @ddlovato | Music | 43.4M |
| 38 | Jimmy Fallon | @jimmyfallon | Entertainment | 43.2M |
| 39 | PlayStation | @PlayStation | Gaming | 43.1 |
| 40 | Britney Spears | @britneyspears | Music | 43M |
Top 40 most-followed X accounts Total follower count in millions, as of March 18, 2026
III. X Twitter statistics 2026: Usage and engagement
1. Average daily time per user
Among all X Twitter statistics 2026, the engagement metrics from SimilarWeb App Intelligence are the most operationally useful for social media professionals. They are based on actual Android device behaviour in August 2025, not self-declaration, covering approximately 70% of the world’s smartphones.
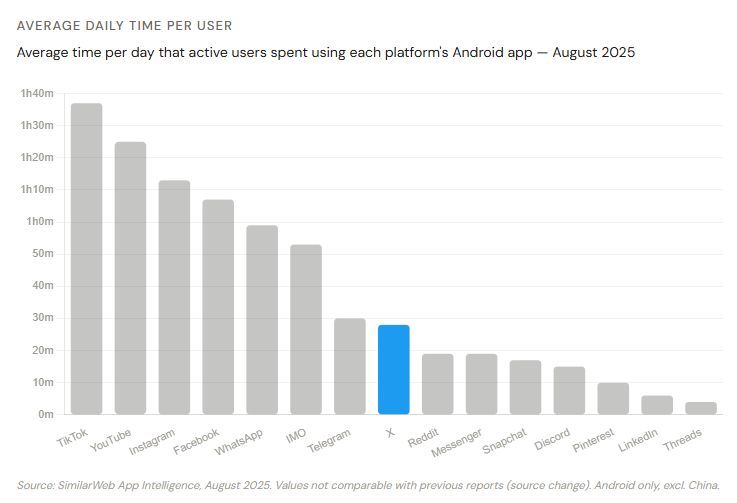
TikTok’s dominance of daily time (1h 37m) is extraordinar, it outpaces YouTube (1h 25m) by 12 minutes per day, a gap that compounds dramatically over weeks and months of algorithmic habit formation. Instagram (1h 13m) and Facebook (1h 07m) complete a top four that all clear the one-hour mark.
X’s 28 minutes/day places it 8th, ahead of Reddit (19m), Messenger (19m), Snapchat (17m), Discord (15m), Pinterest (10m), LinkedIn (6m) and Threads (4m). X generates more daily time per user than Reddit, all messaging apps below WhatsApp, and both of its newest competitors Threads and Discord, a useful counter to narratives of irrelevance. Threads, despite Meta’s aggressive promotion, generates only 4 minutes/day, a fraction of X’s engagement depth.
2. Average daily sessions
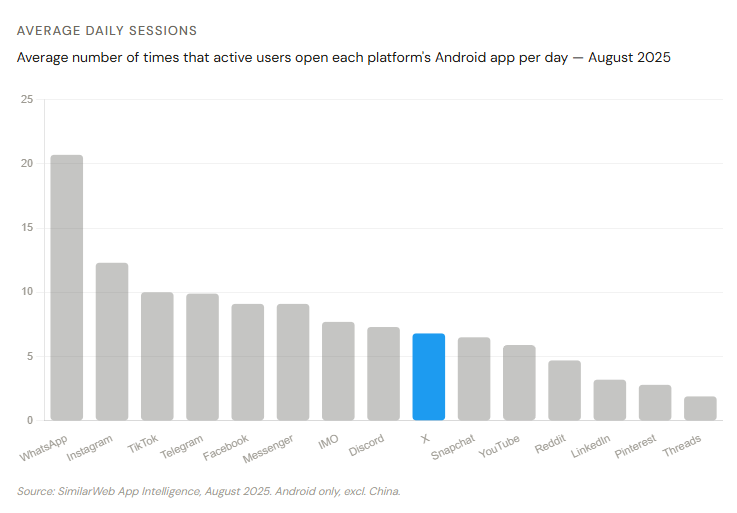
WhatsApp’s 20.7 daily sessions, more than one open every waking hour, reflects its messaging-first utility. Instagram’s 12.3 and TikTok’s 10.0 reflect content-feed platforms optimized for repeated short check-ins. X’s 6.8 daily sessions ranks 9th, ahead of YouTube (5.9), Reddit (4.7) and all other platforms except messaging and social-feed apps.
The session count for X is lower than Instagram and TikTok, but this needs to be read alongside session duration. X users open the app less often but read more each time, a profile consistent with purposeful news consumption rather than mindless scrolling.
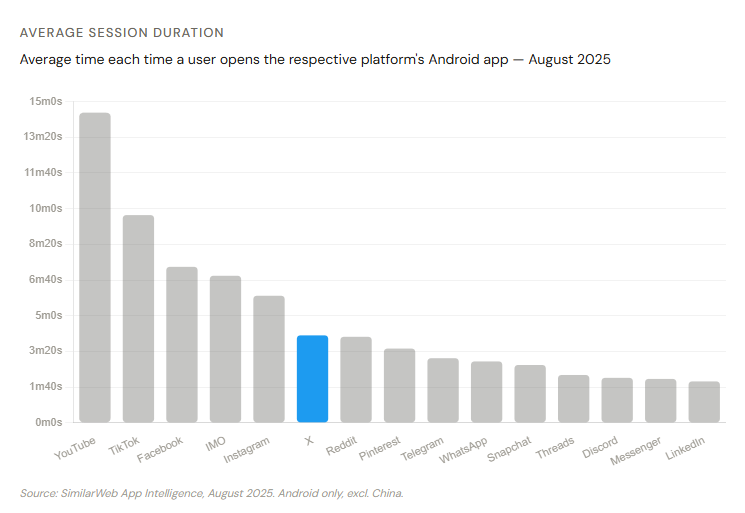
3. Average session duration
Session duration is where X performs best relative to its peers: 4 minutes 05 seconds per session, ranking 6th, ahead of Reddit (4m 01s), Pinterest (3m 28s), Telegram (3m 01s) and all messaging apps. YouTube (14m 29s) leads by a wide margin reflecting long-form video; TikTok’s 9m 42s reflects autoplay loops. Facebook’s 7m 17s is surprisingly high, possibly driven by video content and marketplace browsing.
Reading X’s four engagement metrics together gives a coherent portrait: the platform attracts focused, text-reading sessions. It is opened less often than social apps, but when opened, users engage meaningfully. This is the engagement signature of an information platform, not an entertainment or social platform.
4. What people use each platform for
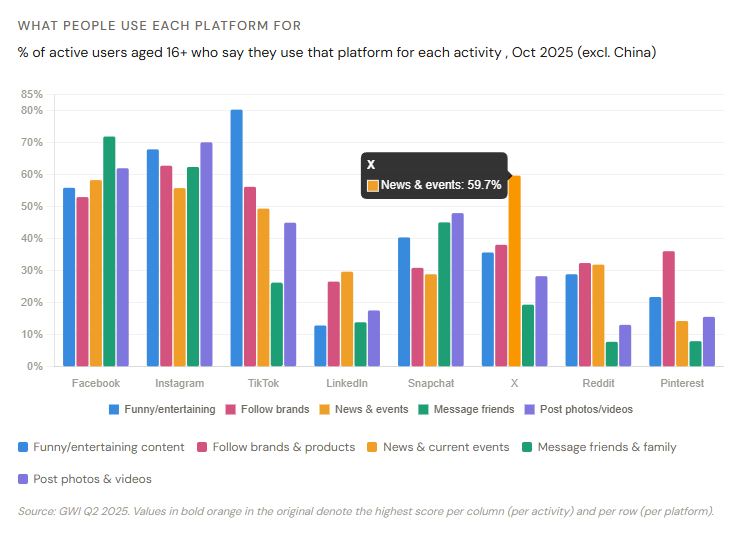
X’s dominant use case: news, confirmed by the data.
With 59.7% of active users accessing X for news and current events, it scores higher on this dimension than any other platform , higher than Facebook (58.3%), Instagram (55.8%), and dramatically higher than LinkedIn (29.7%) which is often cited as a news-reading platform. For PR and communications professionals, this is the single most important data point: X is where news breaks, where journalists look, and where press releases get amplified in real time.
Beyond news, X’s 38.1% score for brand and product research ranks 4th behind Instagram (62.8%), TikTok (56.2%) and Facebook (53.0%) , a respectable position suggesting meaningful purchase influence. Its entertainment score (35.7%) places it 5th, behind TikTok (80.3%), Instagram (67.9%), Facebook (55.9%) and Snapchat (40.4%). X’s lowest scores are for messaging (19.4%, 2nd lowest) and photo/video sharing (28.3%, 5th), consistent with its text-first heritage.
TikTok’s 80.3% dominance for entertainment, Instagram’s 70.1% for photo/video sharing, Facebook’s 71.9% for messaging, and Snapchat’s 48.0% for photo/video posting , each platform clearly owns a behavioural niche. X’s niche is news. No platform comes close on that dimension.
5. X (Twitter) as the world’s real-time event monitor
Still unmatched for live events: from World Cups to state funerals
Even in a period of overall audience decline, X retains one capability that no other platform has replicated at scale: the ability to function as a global, real-time, open information layer around live events. Whether a football final is being played, a verdict is being announced, a political leader is stepping down or a red carpet is unfolding, X is where journalists, experts, eyewitnesses and opinion leaders narrate the moment as it happens , and where the public goes to follow along, react and share.
The numbers behind this role are striking. X generates an estimated 500 million posts per day in 2024-2025, according to consistent estimates across Statista, DataReportal, SimilarWeb, Sprout Social and SocialPilot. During major live events, the platform’s post velocity surges far above its daily baseline, producing some of the highest concentrations of real-time public expression ever recorded on any digital medium:
| Event | Date | Peak activity | Context |
| FIFA World Cup 2022 final | Dec 18, 2022 | 24,400 posts/sec | Argentina vs France; all-time record |
| Japan scores vs Germany, World Cup | Nov 23, 2022 | 20,600 posts/sec | Japan’s comeback win; Japan highest X-use country |
| Super Bowl LVII | Feb 12, 2023 | 14,300 posts/sec | Kansas City Chiefs vs Philadelphia Eagles |
| Will Smith / Oscars “slap” moment | Mar 27, 2022 | 12,700 posts/sec | Instant global reaction; trending within 30 seconds |
| Super Bowl LIX | Feb 9, 2025 | 13M posts total | 4.5B impressions · 511M video views · 3.3M unique authors |
| Biden retirement announcement | Jul 21, 2024 | 400M views | Most-reported post of 2024; linked from 4,700+ websites |
| FIFA World Cup 2014 (full tournament) | Jun–Jul 2014 | 672M tweets | 32-day tournament; peak at 618,725 tweets/min in final |
| Obama anti-racism tweet (most liked ever) | Aug 12, 2017 | 4.5M likes · 1.4M RTs | Response to Charlottesville; most-liked post in platform history |
Sources: David Sayce / dsayce.com (posts/sec data, 2025); X official blog (World Cup 2014); X @Sports account (Super Bowl LIX, February 2025); Majestic blog (Biden tweet, 2024); Wikipedia (Obama likes). Peak posts/sec figures are real-time spikes, not sustained averages.
These figures illustrate a structural truth that no competitor has yet displaced: when something important happens in the world, X is where the first public reaction forms. The platform’s architecture , open, asymmetric, chronological at its core, and built around short-form text , is uniquely suited to the speed of breaking events. A football goal, an election result, an assassination attempt, a celebrity death, a corporate announcement or a diplomatic incident all produce the same pattern: a spike in real-time posts, a rush of journalists and eyewitnesses adding primary source material, and an instant global conversation that other platforms can only echo after the fact.
This is why X remains the tier-1 monitoring environment for PR professionals, media intelligence analysts, crisis communicators and competitive intelligence teams , even as its overall user numbers plateau. In 2024, X generated 8.3 billion video views per day (+40% year-on-year), and 363.6 billion daily user seconds (+12% year-on-year) in Q2 2024, showing that the depth of engagement around events is not diminishing. During U.S. primaries alone, X generated 2.9 billion impressions. Twitter Spaces usage has tripled around major events, adding a live audio layer to the platform’s real-time text infrastructure.
For journalists and media monitors, the value of X at events is not only volumetric. Research confirms that verified journalists and emergency agencies achieve substantially higher engagement and response rates than other account types , meaning that when accuracy is at stake, the platform’s audience naturally gravitates toward credible sources. From the Arab Spring to the 2024 U.S. election, from the Champions League final to a royal family health crisis, X has been the first place the world found out , and discussed what it meant.

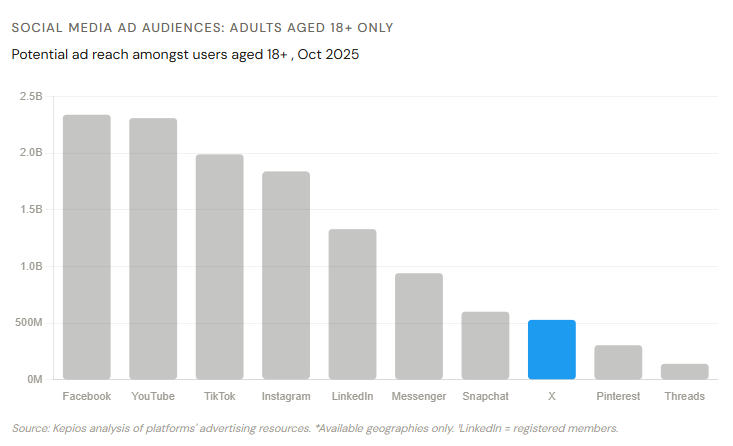
IV. X Twitter statistics 2026 for brands and advertisers
1. X Advertising Reach Statistics
X ranks 9th on total reported advertising reach (557M) and 8th for adults 18+ (529M). The platform reaches more adults than Pinterest (305M) and Threads (141M), and is within 72M of Snapchat (601M). The comparison with LinkedIn (1.33B) is instructive: LinkedIn’s figure is based on total registered members rather than active users, meaning the actual active addressable audience gap between the two platforms is likely narrower in practice. The YouTube vs Facebook ranking difference between total and 18+ is worth noting: YouTube leads total reach (2.58B) but Facebook leads 18+ (2.34B vs 2.31B), reflecting YouTube’s significant under-18 user base. For brands with adult-only mandates, the 18+ column is the operationally relevant one. For media planning professionals: X’s 529M 18+ addressable audience is larger than many brands realise. The combination of male skew (64.4%), news orientation (59.7%) and relatively affordable CPMs (around $2.09 vs $2.53 on Meta, per Hootsuite 2025 benchmarks) makes X a cost-efficient channel for reaching male news readers in high-intent moments , particularly for finance, technology, automotive and sports categories.
Northern America (19.5%) and Eastern Asia (18.9%) , predominantly Japan and South Korea , together account for 38.4% of X’s entire global advertising audience. South-Eastern Asia (11.7%) completes a top three that collectively represents half the platform’s ad reach. Western Europe (8.3%) ranks 5th, below Western Asia (8.5%). Southern America adds 6.9%. Combined, all European regions (Northern 5.9% + Western 8.3% + Southern 3.6% + Eastern 2.1%) total approximately 19.9% , nearly matching North America alone. For European advertisers, this means X’s global audience is not primarily in their own backyard. Africa, despite its high usage rates in countries like Nigeria and Kenya, generates only 3% of total ad reach combined (Northern 1.4% + Western 1.6% + Eastern 0.9% + Southern 0.6%) , reflecting lower digital advertising infrastructure and platform monetisation in those markets.
2. Notable brand campaigns on X (Twitter)
X’s combination of real-time reach, news consumption behaviour and open public conversation has made it the defining platform for a specific type of brand campaign: reactive, event-driven, culturally relevant and built around a distinctive brand voice. The following cases represent some of the most documented and studied campaigns in the platform’s twenty-year history. Oreo, “Dunk in the Dark” (Super Bowl 2013): the campaign that redefined real-time marketing On February 3, 2013, during a 34-minute power outage at the Mercedes-Benz Superdome in New Orleans, a 13-person social media command centre assembled by Oreo’s agency 360i published a single tweet: “Power out? No problem. You can still dunk in the dark.” The tweet was composed and approved in under a minute. The tweet accumulated approximately 15,000 retweets within a day of posting. The “Dunk in the Dark” image garnered $525 million in earned media impressions. Oreo’s Twitter followers increased by 8,000, and its Instagram following grew from 2,000 to 36,000 in the immediate aftermath. The campaign won a Cannes Silver Lion for Best Use of Digital Direct Marketing. The Huffington Post declared it “one of the most buzz-worthy ads of the Super Bowl, and it wasn’t even a commercial.” The campaign is widely cited as the founding moment of the “social media war room” model, inspiring brands across every sector to establish dedicated real-time response teams for major live events. For PR and media monitoring professionals, it established a template that is still in active use: pre-position a team around a live event, monitor in real time, act within minutes of an unexpected moment. Wendy’s, “Roast” strategy and #NationalRoastDay (2017, ongoing), voice as a competitive weapon In 2017, Wendy’s eliminated the bureaucratic approval process for its Twitter account and gave its social team the freedom to respond in real time, including to competitors. The result was a brand voice, sarcastic, direct and genuinely funny, that became one of the most studied in social media marketing. The “Nuggs for Carter” campaign in 2017, where Wendy’s challenged a user to achieve 18 million retweets for a year of free nuggets, generated over 3.4 million retweets and an estimated $8 million in earned media value. Wendy’s reported a 4.9% increase in same-store sales in that same breakout year. The annual #NationalRoastDay campaign generated over 130 million impressions in 2022. The #NationalRoastDay hashtag has accumulated over 116 million views on TikTok, reaching 30% of the platform’s audience. As of 2023, Wendy’s had approximately 3.8 million Twitter followers, a base built almost entirely through organic engagement rather than paid promotion. Wendy’s was named one of the World’s Most Innovative Companies in social media by Fast Company. Dove, #SpeakBeautiful (2015), social listening turned into social impact Dove launched #SpeakBeautiful in partnership with Twitter, responding to research showing that women send approximately 5 million negative beauty-related tweets per year. The campaign used Twitter’s social listening infrastructure to identify and reply in real time to women posting negatively about their own appearance.
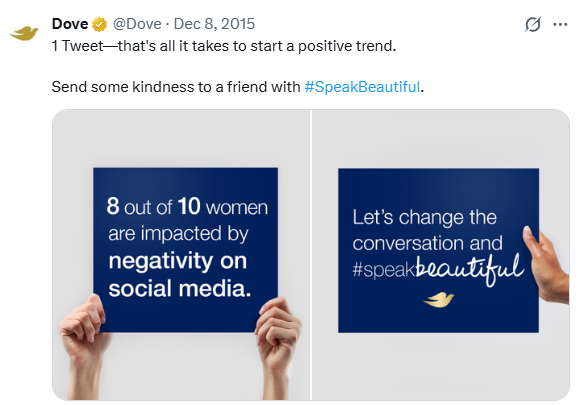
Dove’s #SpeakBeautiful campaign achieved a 36% reduction in negative beauty tweets during the campaign period. The initiative was cited by Twitter itself as a landmark demonstration of how brands could use the platform’s real-time listening capabilities not just for marketing but for measurable cultural impact. Nike, #Breaking2 (2017), Twitter as a global live broadcast platform Nike used Twitter as the primary distribution channel for its attempt to break the two-hour marathon barrier, with runners Eliud Kipchoge, Lelisa Desisa and Zersenay Tadese. The event was broadcast live on Twitter simultaneously across global time zones, with real-time commentary, alerts and engagement from Nike’s account.
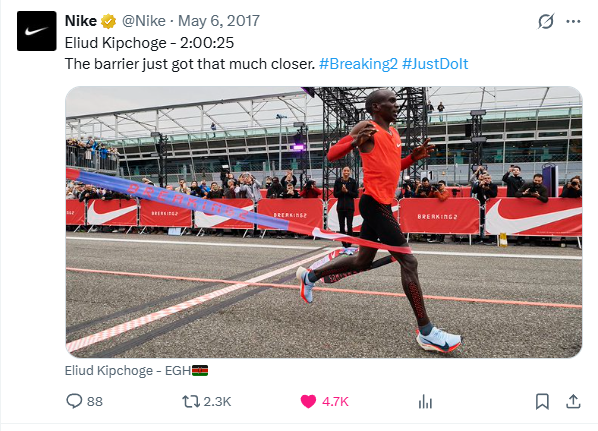
Nike built a global audience for a single online live event across multiple time zones, establishing Twitter as a broadcast-quality live event platform for brand campaigns. Kipchoge ran 2:00:25, 25 seconds short of the barrier, and Nike’s post-race tweet became one of the most-engaged brand moments of that year. The campaign demonstrated that Twitter’s combination of real-time conversation and live video could substitute for traditional broadcast advertising at scale. Super Bowl LIX brand activity (February 2025), the platform still sets the real-time standard The most recent major event data confirms that X retains its structural position for brand activity around live events. The Super Bowl LIX conversation alone drove 4.5 billion impressions and 511 million video views on X, generated by 3.3 million unique authors. Brands including Budweiser, Nike, and dozens of major CPG companies use X’s paid amplification products (Promoted Trend Spotlight, In-Stream Video Ads) to position alongside this organic conversation. What the data shows for brand strategy on X Taken together, these cases and the broader platform benchmarks confirm a consistent pattern for brands that succeed on X: X users are 32% more likely to try new products first, 24% more likely to share product recommendations, and 39% more likely to purchase advertised products than non-X users. 58% of X users engage with brand content every week. Over 1,700 advertisers returned to X in the last quarter, including 90 of the top 100 ad spenders from the previous year. X is used by 39% of social media marketers, with 16% citing it as the channel that delivers their highest ROI, according to HubSpot’s State of Marketing 2024 report. The pattern across all successful brand campaigns on X is consistent: speed of response, cultural relevance to a live moment, a distinctive and authentic brand voice, and the structural advantage of X as the platform where journalists, editors and opinion leaders are most likely to amplify organic content beyond the platform itself.
V. X (Twitter): Revenue and financial performance
Since the Musk acquisition, X no longer publishes quarterly financial reports. All figures below are estimates from WARC, eMarketer, Social Media Today and Business of Apps, and should be treated as directional.
| Year | Estimated global ad revenue | YoY change | Context |
| 2019 | $2.99 B | +14% | Pre-pandemic growth |
| 2020 | $3.21 B | +7% | COVID-19 slowdown |
| 2021 | $4.51 B | +40% | Peak Twitter ad year |
| 2022 | ~$4.40 B | -2% | Musk acquisition in Oct; advertiser uncertainty |
| 2023 | ~$3.40 B | -23% | Post-acquisition advertiser exodus |
| 2024 | ~$2.00 B | -41% | Continued brand safety concerns |
| 2025 (proj.) | ~$2.26 B | +16.5% | First increase since acquisition (eMarketer) |
Sources: Twitter annual reports (2019-2021); WARC / Statista / Social Media Today estimates (2022-2024); eMarketer projection (2025).
| Financial metric | Value | Note |
| Acquisition price (Oct 2022) | $44 billion | Musk’s purchase price |
| Estimated 2024 total net revenue | ~$2.6 billion | All sources combined |
| Estimated 2025 ad revenue (global) | ~$2.26 billion | eMarketer, March 2025 |
| Estimated 2025 US ad revenue | ~$1.31 billion | +17.5% YoY (eMarketer) |
| Annual debt servicing cost | ~$1.2 billion | Acquisition financing |
| Current valuation (early 2025) | ~$44 billion | Recovered from ~$12.32B low |
| Musk’s 2028 revenue projection | $26.4 billion | Widely considered unachievable |
Sources: Social Media Today (September 2025); eMarketer / The Wrap (March 2025); Fidelity Investments.
Twitter’s advertising revenue peaked at approximately $4.5 billion in 2021. By 2024, third-party estimates put ad revenue at approximately $2 billion, a reduction of more than 55% in three years. The 2025 partial recovery (+16.5% projected, eMarketer) is real but fragile. As one eMarketer analyst noted, some of the recovery is “being driven by fear,” with companies spending on X to avoid potential political or legal repercussions from the Musk-Trump alignment. Fear is not a sustainable revenue driver. More structurally positive is the growth of SMB (small and medium-sized business) advertisers on X, a segment Twitter historically struggled to attract and which now constitutes a growing share of X’s revenue base.
VI. Twitter becomes X: the Musk acquisition in figures
Elon Musk formally completed his acquisition of Twitter on October 27, 2022, for $44 billion , a deal that had been acrimonious and legally contested over several months. The platform was rebranded as X on July 23, 2023. The key figures of this transition:
| Milestone | Date | Detail |
| Acquisition completed | October 27, 2022 | $44 billion; acrimonious, contested deal |
| Staff headcount at acquisition | Oct 2022 | ~7,500 full-time employees |
| Staff headcount post-cuts | Jan 2023 | ~1,300 full-time employees |
| Staff reduction | Oct 2022 – Jan 2023 | ~80% reduction |
| Platform rebranding | July 23, 2023 | Twitter → X; blue bird → X logo |
| Trust and Safety Council dissolved | Dec 2022 | Replaced by community-based system |
| Paid verification launched | Nov 2022 | X Premium / Blue tick |
| Algorithm open-sourced | Mar 2024 | Published on GitHub |
| Advertiser exodus peak | 2023 | Apple, Disney, IBM and others paused |
| Advertiser partial return | 2025 | Apple, Disney returned post-Trump election |
| User loss projection | Dec 2022 | ~30M expected to leave by end 2024 |
| Actual platform usage (Q2 2025) | Jun 2025 | 29.2% self-declared monthly use (stable) |
Sources: Public record; GWI Q2 2025; CNBC January 2023; Social Media Today.
The operational transformation under Musk has been radical. Key platform changes include: the introduction of paid verification (X Premium), the dismantling of the Trust and Safety Council, reinstatement of previously banned accounts (including Donald Trump, who was restored in November 2022), the introduction of Community Notes as the primary misinformation response tool, dramatic increases to API access pricing that forced out many third-party developers and academic researchers, and the open-sourcing of the recommendation algorithm in early 2024.
The advertiser exodus that followed , driven by brand safety concerns about ad placement alongside harmful content, and by the reinstatement of controversial accounts , was the most damaging commercial consequence. Major brands including Apple, Disney, IBM and others paused spending. Recovery began in early 2025, partly driven by the political context of Trump’s election victory and Musk’s role in the new administration. As one eMarketer analyst noted, some of X’s ad growth in 2025 is “being driven by fear,” as companies view spending on X as “a cost of doing business in order to mitigate potential legal or financial repercussions” , a precarious and unsustainable driver of revenue.
The emergence of Bluesky and Threads as alternatives has not produced the mass migration many predicted, but both platforms are growing: Threads now reaches 142M in ad audience, up from 141M in the 18+ count, though it generates only 4 minutes of daily time per user.
VII. X algorithm, moderation and information quality
This section draws on peer-reviewed academic research published in 2024-2025.
The open-sourced algorithm.
In early 2024, X open-sourced its recommendation algorithm on GitHub , an unprecedented transparency measure. The algorithm processes approximately 5 billion ranking decisions daily. Academic researchers have since used this and related methods to study its political effects.
Evidence of political bias in content curation.
A 2025 study published at the ACM Conference on Fairness, Accountability, and Transparency (FAccT), auditing algorithmic amplification during the 2024 U.S. presidential election, found that X’s algorithm “may have moved away from promoting moderate content to reinforcing users’ existing preferences more explicitly, especially in out-of-network recommendations.” The study found that right-leaning accounts are more prominently featured in X’s algorithmic curation, including a “default right-leaning bias observed for neutral accounts” , meaning new users are likely to encounter partisan content early in their engagement with the platform (ACM FAccT, March 2025).
Elon Musk’s account amplification.
Researchers at the Penn Center on Media, Technology and Democracy found that Musk’s account had substantially higher baseline view counts compared to other accounts (an average difference of approximately 4.43 million views prior to the identified change point), and that this advantage increased sharply after Musk endorsed Donald Trump on July 13, 2024. The authors concluded this “may hint at the possibility of algorithmic prioritization or bias” (Tech Policy Press, November 2024).
Causal evidence of polarisation.
A study published in Science (late 2025), conducted via a browser extension experiment with 1,256 volunteers during the 2024 U.S. presidential campaign, provided causal evidence that greater exposure to content expressing anti-democratic attitudes and partisan hostility measurably alters political polarisation. The findings directly contradict earlier Meta-funded research that found no such relationship on Facebook and Instagram , a distinction with significant implications for how the platforms compare on societal impact.
Information quality decline post-acquisition.
Research published in the Harvard Kennedy School Misinformation Review (July 2025) used NewsGuard credibility scores across two datasets (a Twitter panel and the Decahose firehose) and found consistent evidence of declining average information quality following the ownership change. The proposed mechanisms include: algorithmic amplification of engagement-driven content at the expense of credibility; shifts in user composition (high-credibility sharers leaving, low-credibility sharers remaining); and relaxed content moderation policies including the reinstatement of previously banned accounts.
Community Notes: effectiveness and limitations.
X’s transition from professional third-party fact-checking to crowd-sourced Community Notes mirrors a shift Meta announced in January 2025. Research from MIT Sloan (2025) found that fact-check warning labels reduce belief in false headlines by 27% and sharing of false headlines by 25% , effects that persist even among people who distrust fact-checkers (13% and 17% reduction respectively). Whether Community Notes achieves comparable effectiveness at scale remains an open research question. A 2025 study in Nature Scientific Reports examining Twitter’s COVID-19 moderation found that vaccine-skeptical account clusters continued to spread misinformative content despite sustained removal , suggesting that the challenge of effective moderation predates the Musk era, but that structural dismantling of moderation infrastructure has amplified it.
For brand safety and communication professionals: The academic literature on X’s post-Musk content environment is now substantial and consistently points in the same direction: lower average information quality, measurable algorithmic amplification of partisan content, and reduced professional fact-checking infrastructure. These are not reputational risks but documented operational realities that inform brand placement decisions, media monitoring methodology, and the weight given to X-sourced intelligence in competitive analysis.
VIII.X’s impact on elections: A data-driven exploration (2006–2026)
Since its launch in 2006, X (formerly Twitter) has evolved from a real-time news tool into a powerful, and controversial, force in electoral politics. It enables direct candidate-voter communication, rapid mobilization, and agenda-setting, but also amplifies misinformation, polarization, and algorithmic bias. Below is a factual overview grounded in peer-reviewed studies, Pew Research, and independent reports up to early 2026. No causal claims are overstated; effects are often correlational or from randomized experiments.
1. Historical impact (Pre-musk era, 2006–2022)
Early academic evidence suggests Twitter sometimes acted as a counterweight to conservative candidates in U.S. presidential races. A Princeton/NBER study using the staggered rollout of Twitter (instrumented via SXSW 2007 early adopters) found that higher local Twitter adoption reduced Republican presidential vote share by approximately 0.5 percentage points per 10% increase in users during the 2016 and 2020 elections. The effect was limited or absent in congressional races, implying platform content may have swayed moderates and independents toward more liberal-leaning narratives at the presidential level.
Globally, X played catalytic roles in events like the Arab Spring (2011) through real-time coordination, but election-specific studies (e.g., Brexit 2016, U.S. 2016) highlighted Russian interference campaigns that reached millions via targeted accounts and bots. Pre-2022, the platform was often credited with increasing political engagement while raising concerns about filter bubbles.
2. Algorithmic feed effects: Evidence from the landmark 2026 Nature study
Post-acquisition (October 2022), X shifted its default feed to algorithmic (“For You”). A rigorous randomized controlled field experiment published in Nature (February 18, 2026) by Gauthier, Hodler, Widmer, and Zhuravskaya provides the strongest causal evidence to date.
Methodology: ~4,965 U.S. active users were randomly assigned for ~7 weeks (July–September 2023) to either the algorithmic feed or chronological (“Following”) feed. Pre- and post-surveys measured attitudes; browser extensions tracked content and follows (compliance ~85–89%).
Key findings:
- Switching to the algorithmic feed increased overall engagement (+0.14 standard deviations) and shifted political attitudes toward more conservative positions (+0.11–0.12 s.d. on a composite index of policy priorities and news attitudes).
- Specific shifts included: stronger support for Republican-leaning priorities (e.g., immigration, inflation; +4.7 percentage points), viewing Trump investigations as more “unacceptable,” and more pro-Kremlin stances on Ukraine.
- Mechanism: The algorithm promoted conservative content (+2.9 pp), activist accounts (+5.9 pp), and demoted traditional media (−15.5 pp). Users exposed to it followed more conservative/activist accounts (+0.17–0.18 s.d.), creating persistent effects even after reverting to chronological feed.
- Effects were asymmetric (switching off the algorithm had no impact) and stronger among Republicans and Independents. No increase in partisanship or affective polarization.
The authors conclude that “initial exposure to X’s algorithm has persistent effects on users’ current political attitudes and account-following behaviour.” This has clear implications for election cycles: algorithmic promotion can tilt information environments in tight races.
3. Misinformation, amplification, and the 2024 U.S. presidential election
During the 2024 campaign, X became a focal point for election-related claims. A Center for Countering Digital Hate (CCDH) analysis documented at least 87 false or misleading posts by Elon Musk himself, accumulating over 2 billion views on the platform. Experts (including Carnegie Mellon’s Kathleen Carley) described X as the “epicenter” of U.S. election misinformation, with content spreading via network effects to other platforms.
Additional studies:
- An arXiv audit of 2024 data found the algorithm amplified “own-side” content for both parties but showed right-leaning bias for neutral users and higher exposure inequality for right-leaning accounts.
- Social media mention volume (buzz) predicted Senate and tight-race outcomes earlier than traditional polls (Penn State research).
- Record usage during the election night period, yet concerns over AI-generated images, deepfakes, and participatory disinformation (e.g., false voter-fraud videos in Pennsylvania).
Musk’s personal endorsement of Donald Trump and platform changes (reduced moderation staff, Community Notes system) coincided with these patterns. X’s spokesperson defended Community Notes as more effective than legacy warning labels.
4. Partisan perceptions on X (Pew research, 2024–2025)
U.S. users’ experiences on X diverged sharply by party:
- 51% of Republicans rated their time on X as “mostly positive” (vs. 20% of Democrats).
- 55% of Democrats said X favors conservative views; only 13% of Republicans agreed.
- Views on democracy: Republicans saying X is “mostly good” for U.S. democracy rose from 17% (2021) to 58% (2025); Democrats fell from 47% to 17%.
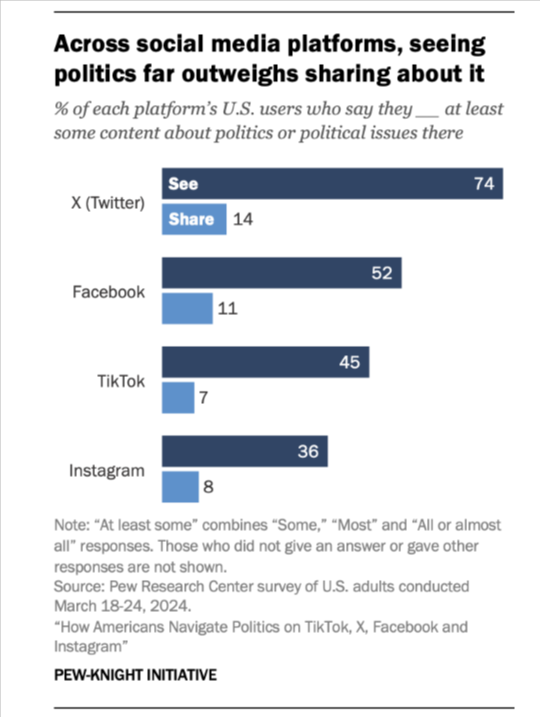
- 74% of X users encounter political content (higher than Facebook 52%, TikTok 45%, Instagram 36%); 59% use it to follow politics.
These divides intensified after 2022 changes, with Democrats more concerned about misinformation and harassment.
5. International and European contexts (including France)
- 2022 French presidential election: A network analysis using daily tweet data and Convergent Cross Mapping (Frontiers in Political Science, 2025) revealed asymmetric causal influences. Candidates like Éric Zemmour exerted broad one-way influence (especially on immigration), while Emmanuel Macron’s health-policy posts had the strongest causal pull. Foreign policy (Ukraine) and health topics drove cross-party synchronization pre-election; post-election, ecology and left-wing alliances (NUPES) increased clustering. No direct vote-share causation measured, but the platform facilitated agenda-setting and ideological echo chambers.
- 2024 European parliamentary elections: Multi-platform studies showed X used for campaigning, but Russian-linked “Doppelgänger” disinformation networks were active. French authorities opened investigations into X for potential algorithmic facilitation of foreign interference.
- Other cases: India 2024 (mobilization + misinformation spikes); Indonesia 2024 (candidate disinformation via social media).
Overall assessment and ongoing debates
X demonstrably influences engagement, information exposure, and attitude formation, with measurable rightward algorithmic tilt post-2022 and high-visibility misinformation in 2024. Pre-Musk evidence pointed to occasional liberal-leaning net effects; post-Musk dynamics reversed for many metrics. Positive roles include real-time discourse, candidate direct reach, and predictive signals from mentions. Challenges persist around brand safety, foreign interference, and echo chambers.
No single study proves X “decided” any election, but cumulative evidence shows it shapes the information environment in which voters decide, especially in polarized, close contests. As X marks 20 years in 2026, ongoing academic monitoring (NYU CSMaP, Pew) and regulatory scrutiny continue. For deeper dives, tools like social listening remain essential for tracking real-time dynamics.
Sources drawn from Nature (2026), Pew Research Center (2024–2025), CCDH/Reuters (2024), Frontiers in Political Science (2025), NBER/Princeton (2023–2024), and related peer-reviewed audits.
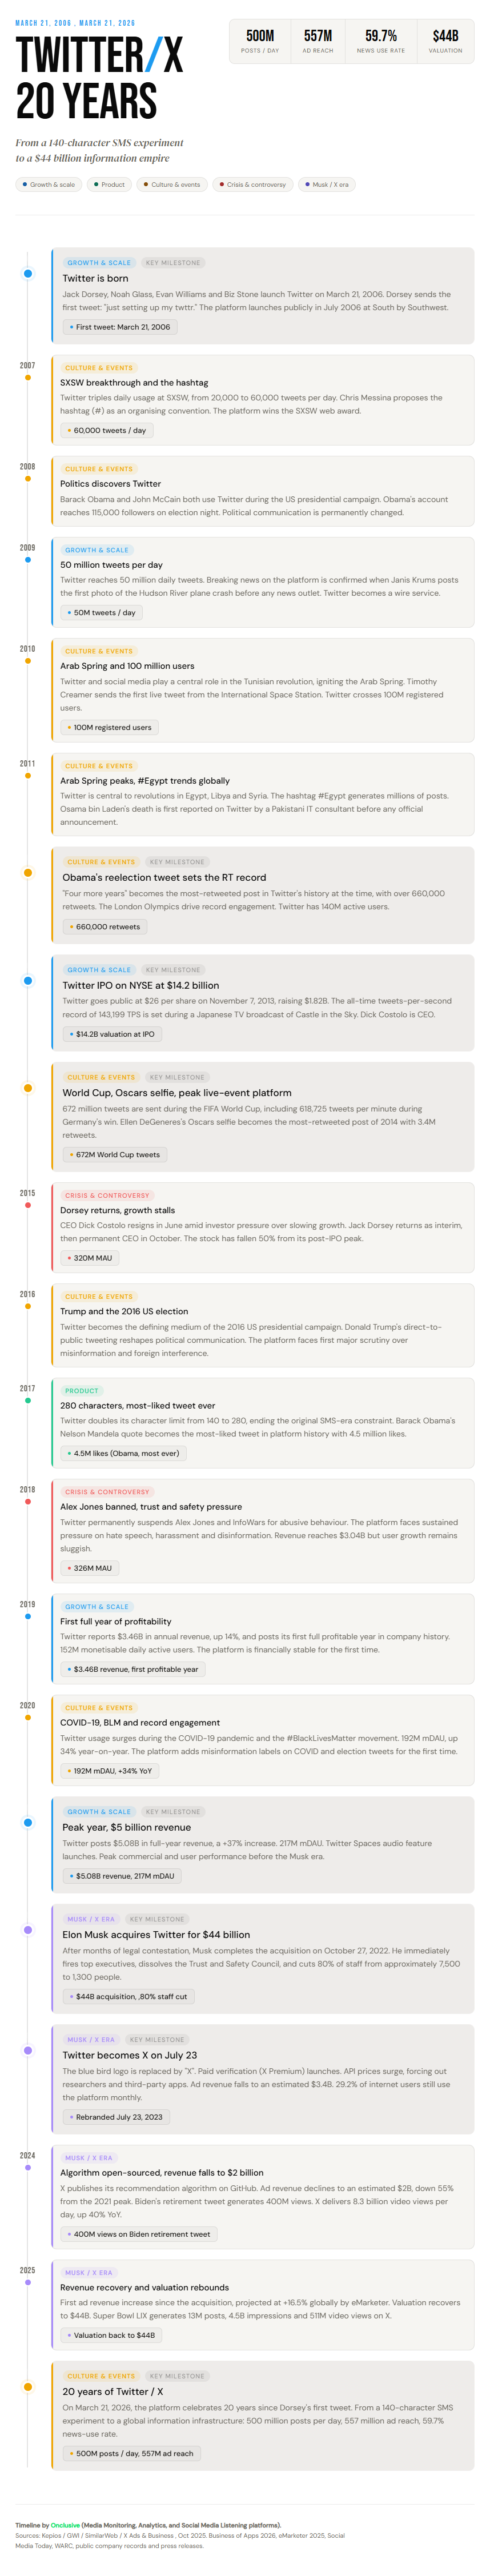
IX. Infographic: A 20-Year Timeline of Twitter-X
The timeline covers 21 milestones from 2006 to 2026, organised into 5 filterable categories:
- Blue, “Growth & scale”, user and revenue milestones (IPO, 50M tweets/day, revenue peak)
- Green, “Product”, feature launches (280 characters, Twitter Spaces, algorithm open-source)
- Amber, “Culture & events”, cultural turning points (Arab Spring, World Cup, Oscars selfie, Obama tweets)
- Red, “Crisis & controversy”, governance crises (Dorsey return, Alex Jones ban, election misinformation)
- Purple, “Musk / X era”, everything from the $44B acquisition onwards
FAQ: X Twitter statistics 2026, the most asked questions
How many people use X (Twitter) in 2025? As of Q2 2025, 29.2% of global internet users aged 16+ use X monthly (GWI). In absolute terms, X has approximately 388 million monthly active users (Business of Apps, 2026), with a total potential advertising audience of 557.5 million.
Which country uses X the most? Nigeria leads with 80.7% of internet users accessing X monthly, followed by Saudi Arabia (66.7%), Kenya (60.0%) and Turkey (58.7%). In absolute advertising audience size, the United States (99 million) and Japan (71.2 million) are the two largest markets.
What percentage of X users are male? 64.4% of X’s 18+ advertising audience is male, 35.4% female. This gender gap is consistent across all age groups and represents one of the most pronounced gender imbalances in social media.
How much time do people spend on X per day? 28 minutes per day on average (Android active users, August 2025, SimilarWeb), ranking 8th among major platforms. Session duration is 4 minutes 05 seconds, ranking 6th.
How much revenue does X generate? Based on third-party estimates (X no longer publishes official reports), approximately $2.6 billion in total net revenue in 2024, with ad revenue at approximately $2 billion, down from a peak of approximately $4.5 billion in 2021. A +16.5% recovery is projected for 2025 (eMarketer).
Is X still relevant for brand monitoring and PR in 2025? Yes. X’s 59.7% news-use rate — the highest of any social platform, makes it structurally essential for PR monitoring, media intelligence and crisis tracking. Its decline in user numbers has not diminished its role as the primary real-time news distribution channel.
What happened to Twitter’s advertising after Elon Musk’s acquisition? Major advertisers including Apple, Disney and IBM paused spending due to brand safety concerns, contributing to a revenue decline from approximately $4.4 billion (2022) to approximately $2 billion (2024). A partial recovery began in 2025, with some major brands returning and SMB advertisers growing their activity.
How does X compare to Threads? In advertising reach, X (557M total, 529M adults 18+) is substantially larger than Threads (142M total, 141M adults 18+). In engagement, X users spend 28 minutes per day on the app vs Threads’ 4 minutes. Threads has the distribution advantage of Instagram but has not yet established deep daily usage habits.