


Definition:
A social media KPI dashboard is a dynamic summary reporting page within your social media management tool that displays key performance indicators for your business, such as the number of mentions of your brand, share of voice and engagement rate. The data is scalable and constantly refreshed. The choice of data to be displayed can be changed at any time. It is a monitoring tool that enables data-driven decision-making.
In today’s data-driven world, marketing without clear performance metrics is like flying blind. For brands and agencies alike, Key Performance Indicators (KPIs) have become essential—not just in campaign execution but right from the pitch stage. Social media KPIs are no longer a nice-to-have. They’re embedded into client proposals, success metrics, and day-to-day optimisation.
But tracking metrics is only as useful as the way they’re presented. That’s where a smart KPI dashboard comes in. Done right, it becomes your marketing mission control—dynamic, customisable, and built for decision-making.
Here are four smart ways to design a KPI dashboard that delivers insight, not just information.
Table of Contents:
4 Key Takeaways – Best Practices for a KPI dashboard
How to Design Your Dashboard Around the KPIs That Matter Most
How to Use the Right KPI Dashboard Structure for the Job
By Channel
By Marketing Funnel Phase
By Region or Market
By Priority KPIs
Choose a Format That Reflects How You Work
Blend Social media KPIs, Digital and Business KPIs
4 Frequently Asked Questions about KPI dashboards
4 Key Takeaways – Best Practices for a KPI dashboard
- Prioritize Impact Over Volume Your dashboard should spotlight the KPIs directly tied to business objectives and campaign success, not every available metric. Build a hierarchy that lets you move from high-level insights to granular details, and always include competitive benchmarking to maintain context and realistic goal-setting.
- Structure Matters as Much as Content Choose a dashboard organization method that aligns with your business needs—whether by channel (paid/earned/owned), marketing funnel stage, geographic region, or priority metrics. The right structure transforms raw data into actionable intelligence and makes patterns immediately visible.
- Design for Your Team’s Reality Your dashboard should mirror how your organization actually works—aligned with team structures, reporting cadences, and internal workflows. Think of it as a living tool that supports decision-making and communication, not just a static report that displays numbers.
- Connect Social Metrics to Business Outcomes The most powerful dashboards integrate social media KPIs with broader digital and business metrics. By showing how engagement, mentions, and reach connect to website traffic, lead generation, and sales, you prove ROI and demonstrate real commercial impact beyond vanity metrics.
I. How to Design Your KPI Dashboard Around the KPIs That Matter Most
A good KPI dashboard isn’t a data dump—it’s a decision-making tool. That means prioritising your most important KPIs first: the ones tied to objectives, bonuses, or campaign success. These are your headline stats.
But a great dashboard doesn’t stop there. It should also allow you to zoom in and out—from global to granular. Think:
- A total view of X (Twitter) brand mentions
- Followed by filtered views by region, sentiment, or product line
- A hierarchy from Europe > France > Cities, or Instagram > Stories > Paid vs Organic
And alongside your headline stats, include supporting indicators—5, 10 or even 15—like engagement rate, top-performing posts, or follower growth by platform. These aren’t always tied to KPIs, but they enrich your analysis and support smarter decisions.
Bonus tip: Always benchmark against your competitors. Seeing where you stand in context helps recalibrate your goals and keeps you grounded in reality.
II. How to Use the Right KPI Dashboard Structure for the Job
Not all dashboards need to look the same. In fact, choosing the right structure can make your data far easier to interpret. Here are four of the most effective ways to organise your dashboard:
A. By Channel
Split your KPIs by paid, earned, and owned media—plus search reputation.
-
- Paid: Twitter, Instagram, LinkedIn Ads performance
- Earned: Brand mentions in blogs, forums, social media
- Owned: Engagement on your own channels
- Search: Brand visibility in search engine rankings
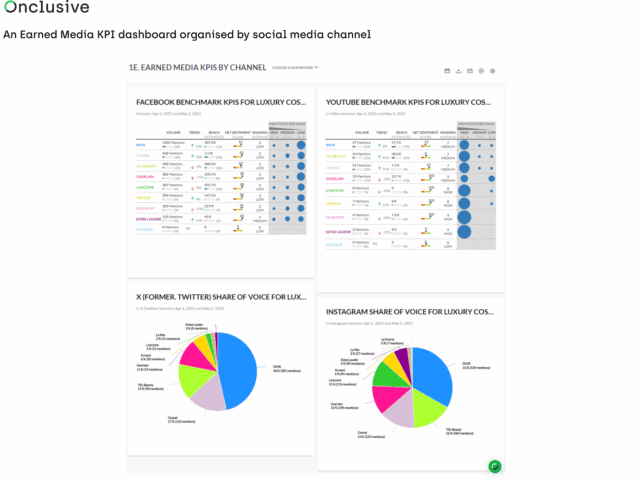
An Earned Media KPI dashboard organised by social media and web channel (via Onclusive Social Listening Tool)
B. By Marketing Funnel Phase
Map KPIs to each stage of your marketing funnel:
Awareness > Acquisition > Interaction > Satisfaction > Conversion
Each tab should show relevant data by channel, region, and product to track movement through the funnel.
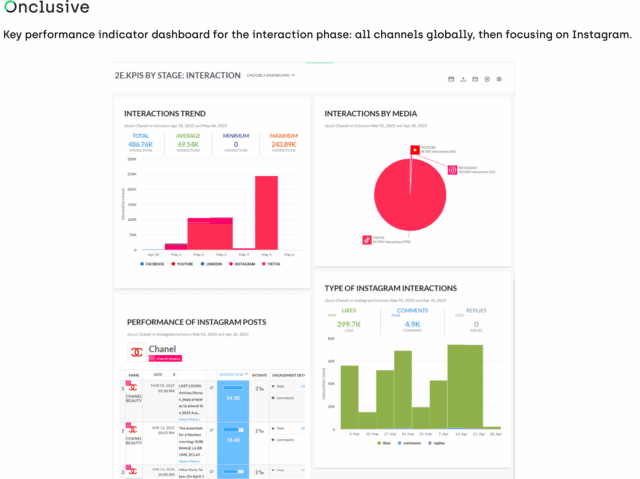
Key performance indicator dashboard for the interaction phase: all channels globally, then focusing on Instagram (via Onclusive Social Listening Tool)
C. By Region or Market
Perfect for multinationals, this layout allows you to analyse social media performance by sales territory, campaign region or product group.
e.g. Western Europe > Product 2, 3, 5 | Asia Pacific > Product 1, 2, 4
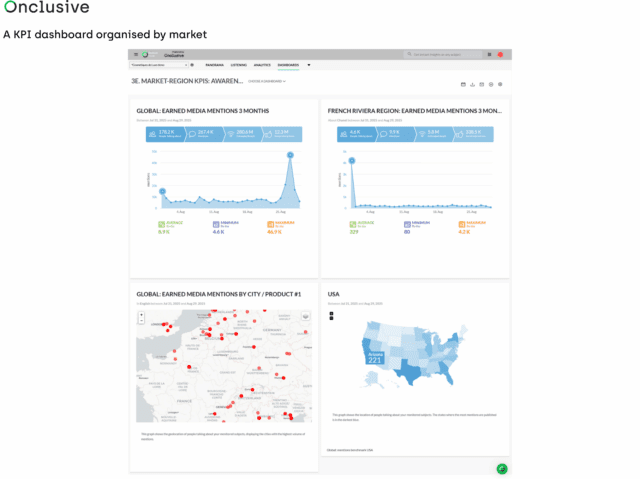
An extract from the Market KPI dashboard (via Onclusive Social Listening Tool)
D. By Priority KPIs
For a top-level snapshot, create a one-page view of your headline metrics.
Example:
- Main KPIs: Mentions, Reach, Engagement
- Secondary: Influencer score, sentiment rate, share of voice
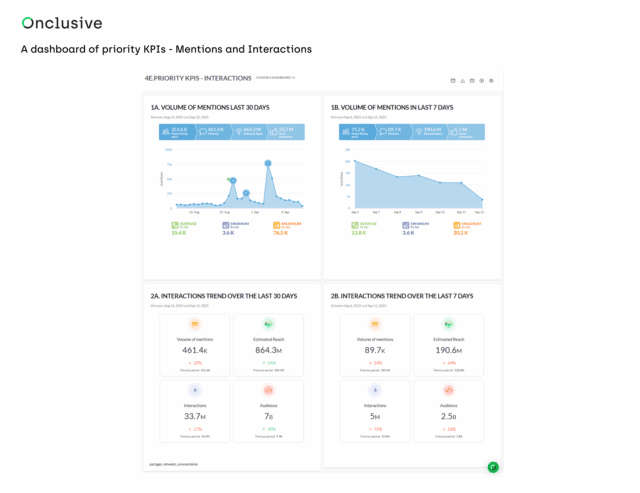
A dashboard of priority KPIs – Mentions and Interactions (via Onclusive Social Listening Tool)
III. Choose a Format That Reflects How You Work
Your KPI dashboard shouldn’t just look good—it should fit your team structure, reporting process, and internal goals. That means:
- If your team is structured by product line, start there.
- If you report monthly to execs, ensure it’s clean and exportable.
- If you’re working with limited data or budgets, focus on core metrics and scale up.
Think of your dashboard as a living document: flexible, updatable, and designed to support internal comms and decision-making—not just show off numbers.
IV. Blend Social media KPIs, Digital and Business KPIs
The strongest dashboards bring different metrics into one view. That means combining:
- Social Media KPIs: likes, mentions, engagement
- Digital KPIs: site traffic, referral sources, bounce rates
- Business KPIs: lead conversions, sales uplift, retention
Together, these paint a clearer picture of ROI and help link social media activity to commercial outcomes. By doing this, you’re not just tracking campaign noise—you’re proving business impact.
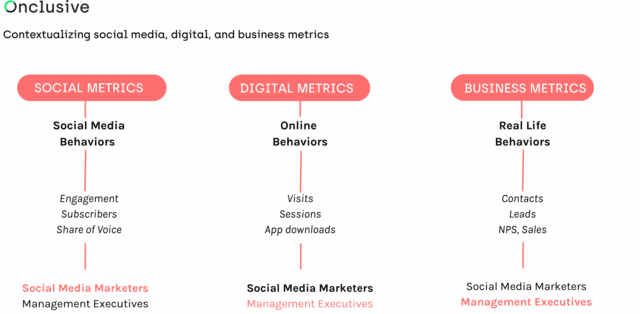
Contextualizing social media, digital, and business metrics
Final Thought: The Best Dashboards Evolve With You
New platforms emerge. Metrics shift. Campaign goals change. Your dashboard should keep up. Build with flexibility, and ensure it covers both earned and owned media from day one. When your data tells a joined-up story—across platforms, teams, and business lines—you’re not just monitoring. You’re managing, improving, and leading.

Ready to take your social media strategy to the next level? Don’t wait to enhance and support your Social Listening analyses with artificial intelligence-powered functions.
4 Frequently Asked Questions about KPI dashboards
Q: What’s the difference between a social media KPI dashboard and a regular analytics report?
A KPI dashboard is a dynamic, constantly-refreshed monitoring tool designed for real-time decision-making, while traditional reports are typically static snapshots. Dashboards allow you to customize which metrics are displayed, drill down from summary to detail, and adjust your view as priorities change—making them far more flexible and action-oriented than periodic reports.
Q: How many KPIs should I include in my dashboard?
Start with 3-5 headline KPIs tied directly to your core objectives (like mentions, reach, or engagement rate), then add 5-15 supporting indicators that provide context and depth. The key is avoiding information overload while ensuring you have enough data to make informed decisions. Your priority metrics should be immediately visible, with secondary metrics available through filtering or drill-down capabilities.
Q: Should I organize my dashboard by channel, funnel stage, or region?
It depends on your business structure and reporting needs. If you manage multiple markets, organize by region. If you’re tracking customer journey, use funnel stages. If you’re comparing paid versus organic performance, structure by channel. Many organizations actually maintain multiple dashboard views—a high-level priority KPI dashboard for executives, plus detailed breakdowns by channel or region for operational teams.
Q: How do I prove ROI by connecting social media metrics to business results?
Integrate social media KPIs (engagement, mentions, sentiment) with digital metrics (website traffic, referral sources) and business KPIs (lead conversions, sales, customer retention) in a unified view. Track how spikes in social engagement correlate with website visits, how brand mentions relate to search volume, and how social campaigns influence conversion rates. This holistic approach demonstrates that social media isn’t just creating buzz—it’s driving tangible business outcomes.